Yay!
No, really…I have been without a watt meter for over a year. This is a tragic thing for an engineer. What happened is that I lent my trusty P3 Kill-A-Watt Meter to a co-worker, who then quit and moved. He did kindly pay me for it on his last day, when he realized he’d never given it back, so there are no hard feelings…
Well, with the restart of this blog, it was obviously time to pickup a new watt meter. I decided to buy the Belkin Conserve meter based on the fact that the display is separate from the wall outlet. This makes it much easier to read…no more bending over to peer behind the desk.
I also picked up a new P3 Kill-A-Watt meter, because I missed my old one so dearly. Also, this is the watt meter that all other watt meters are judged by! See my previous article here:
Both of these power meters cost about $25. The P3 is loaded with many more features, such as monitoring phantom power, real power, line voltage, etc, but for the purpose of this blog all I looked at is the basic power monitoring function.
Of course I then needed to test these two meters against each other. Since the P3 is what I had been using, I wanted to make sure the Belkin reports similar wattage results for a given load. As with any power electronics, it is important to test the circuitry and different load levels to make sure results are consistent with draw. So, I used three household items to benchmark these two watt meters against each other. The items I selected are constant-load items, which means that the power usage doesn’t jump around much during the test. This makes things comparable. Using a computer here would have been difficult, because computer power consumption is all over the place depending on what the darn thing is thinking about in the background.
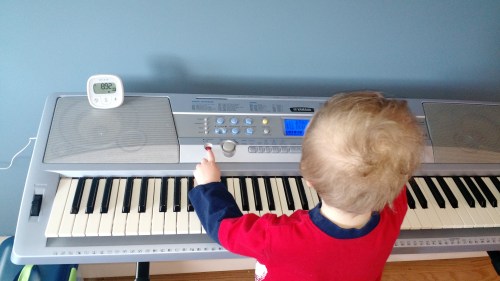
Test 1: Yamaha Piano


The trusty old Yamaha piano was used to test how these watt meters report power for a low-load condition. I set the piano playing one of the generic, annoying songs it came pre-programmed with (all of these songs are now annoying since our 2-year old plays them constantly on repeat). Anyway, here the new Belkin meter showed a slightly higher power consumption than the P3 (8.8 vs 8.2 watts). For these low power levels, the discrepancy was about 7%, which isn’t a great number. This would be a bit disconcerting if we were intending to measure the power consumption of low-draw devices. Thankfully, computers typically draw 100 watts or more.
Test 2: Humidifier


Our bedroom humidifier was used as a representative medium-load device. It draws nominally 40 watts, and some ultra-efficient desktops and many small laptops will have a power consumption in this range. Here, the Belkin meter reported a slightly lower power consumption than the P3 (33.7 vs 35.2 watts). The delta between meters in this case is about 4 percent, which is better than the low-load test but still annoying. Unfortunately, I didn’t have any convienant constant-load items in the 200-300 watt range, so the next test really ramps up the power.
Test 3: Space Heater


The space heater was used to represent a high-load. With a power draw near 900 watts, this would represent a monster desktop with multiple graphics cards. The Belkin reported two less watts consumed than the P3 (874 vs 876 watts). Here, the percent difference is only 0.2%. This is a good number.
Conclusion
For the expected power consumption of desktop computers in the 100-300 watt range, the Belkin and P3 meter will probably be within 2% of each other. The more power consumed, the less the % difference between these two meters. So, I think power readings taken with either meter should be comparable enough to each other. Still, I will likely make all computer measurements with the Belkin, for the aforementioned reasons of ease of viewing. With this meter properly positioned, you can geek out while gaming, folding, or playing the piano. Not bad for 25 bucks, right?