Monthly Archives: May 2020

How to Make a Folding@Home Space Heater (and why would you want to?)

My normal posts on this site are all about how to do as much science as possible with Folding@Home, for the least amount of power. This is because I think disease research, while a noble and essential cause, shouldn’t be done without respecting the environment.

With that said, I think there is a use case for a power-hungry, inefficient Folding@Home computer. Namely, as a space heater for those in colder climates.

The logic is this: Running Folding@Home, or any other piece of software, makes your computer do work. Electricity flows through the circuits, flipping tiny silicon switches, and producing heat in the process. Ultimately all of the energy that flows into your computer comes back out as heat (well, a small amount comes out as light, or electromagnetic radiation, or noise, but all of those can and do get converted back into heat as they strike things in the room).

Have you ever noticed how running your gaming computer with the door to your room closed makes your feet nice and toasty in the winter? It’s the same idea. Here, one of my high-performance rigs (dual NVidia 980 Ti GPUs) is silently humming away, putting off about 500 watts of pleasant heat. My son is investigating:

My Folding@Home Space Heater Experiment

Folding@Home uses CPUs and GPUs to run molecular dynamic models to help research understand and fight diseases. You get the most points per day (PPD) by using cutting-edge hardware, but the Folding@Home Consortium and Stanford University openly encourage everyone to run the software on whatever they happen to have.

With this in mind, I started thinking about all the old hardware that is out there…CPUs and graphics cards that are destined for landfills because they are no longer fast enough to do any useful gaming or decode 4K video. People describe this type of hardware as “bricks” or “space heaters”–useful for nothing other than wasting power.

That gave me an idea…

It didn’t take me long to find a sweet deal on an nForce 680i-based system on eBay for $60 shipped (EVGA board with Nvidia n680i chipset, supporting three full-length PCI-E X16 slots). I swapped out the Core 2 Duo that this machine came with for a Core 2 Quad, and purchased four Fermi-based Nvidia graphics cards, plus a used 1300 Watt Seasonic 80+ Gold power supply. All of this was amazingly cheap. The beautiful Antec case was worth the $60 cost of the parts that came with it alone. Because I knew lots of power would be critical here, I spent most of the money on a high-end power supply (also used on eBay). Later on, I found that I needed to also upgrade the cooling (read: cut a hole in the side panel and strap on some more fans).

  • Antec Mid-Tower Case + Corsair 520 Watt PSU, EVGA 680i motherboard, Core 2 Duo CPU, 4 GB Ram, CD Drives, and 4 Fans = $60
  • 2x EVGA Nvidia GeForce GTX 480 graphics cards: $40
  • 1 x EVGA NVidia GeForce GTX 580 Graphics Card: $50
  • 1 x EVGA NVidia GeForce GeForce GTX 460 Graphics Card: $20
  • 1 x PCI-E X1 to X16 Riser: $10
  • 1 x Core 2 Quad Q6600 CPU (Socket 775) – $6
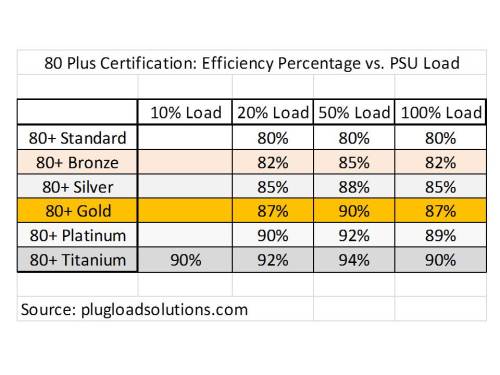
  • 1 x Seasonic 1300 Watt 80+ Gold Modular Power Supply: $90
  • 2 x Noctua 120 MM fans + custom aluminum bracket (for modifying side panel): $60
  • 1 x Arctic Cooling Freezer Tower Cooler – $10
  • 1 x Western Digital Black 640GB HDD – $10

Total Cost (Estimated): $356

This is the cost before I sold some of the parts I didn’t need (Core 2 Duo, Corsair PSU, etc).

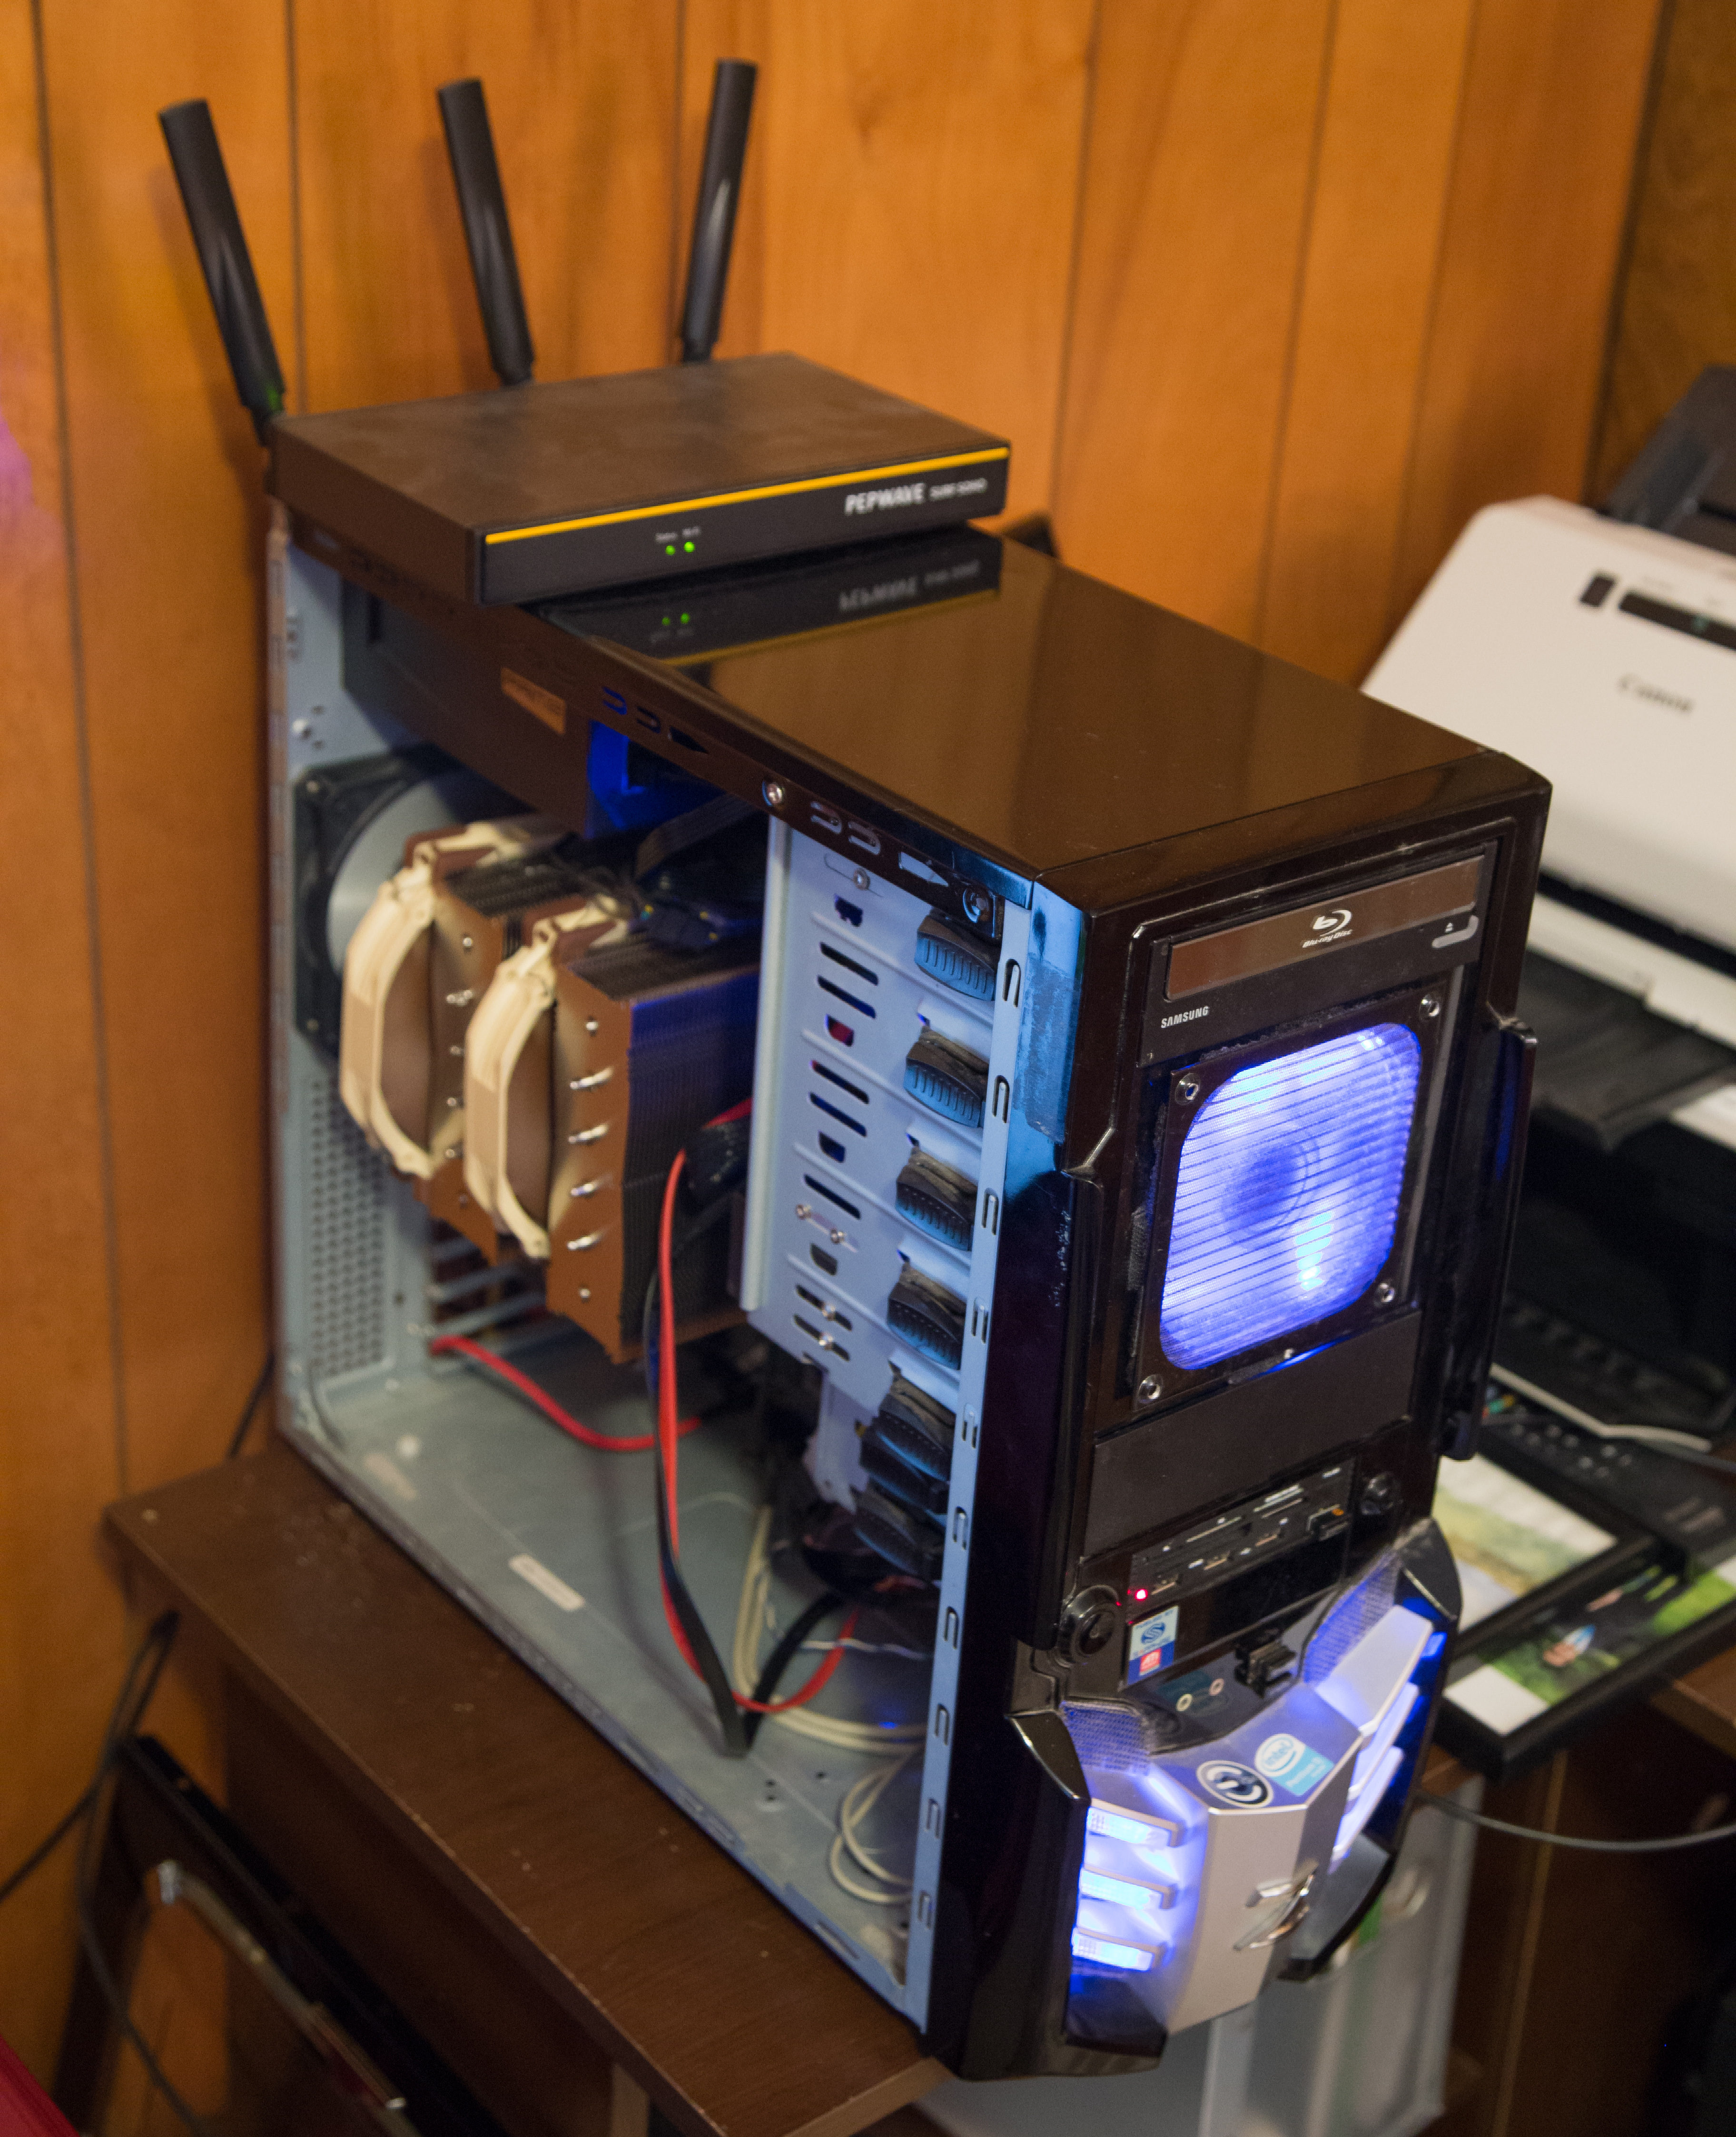
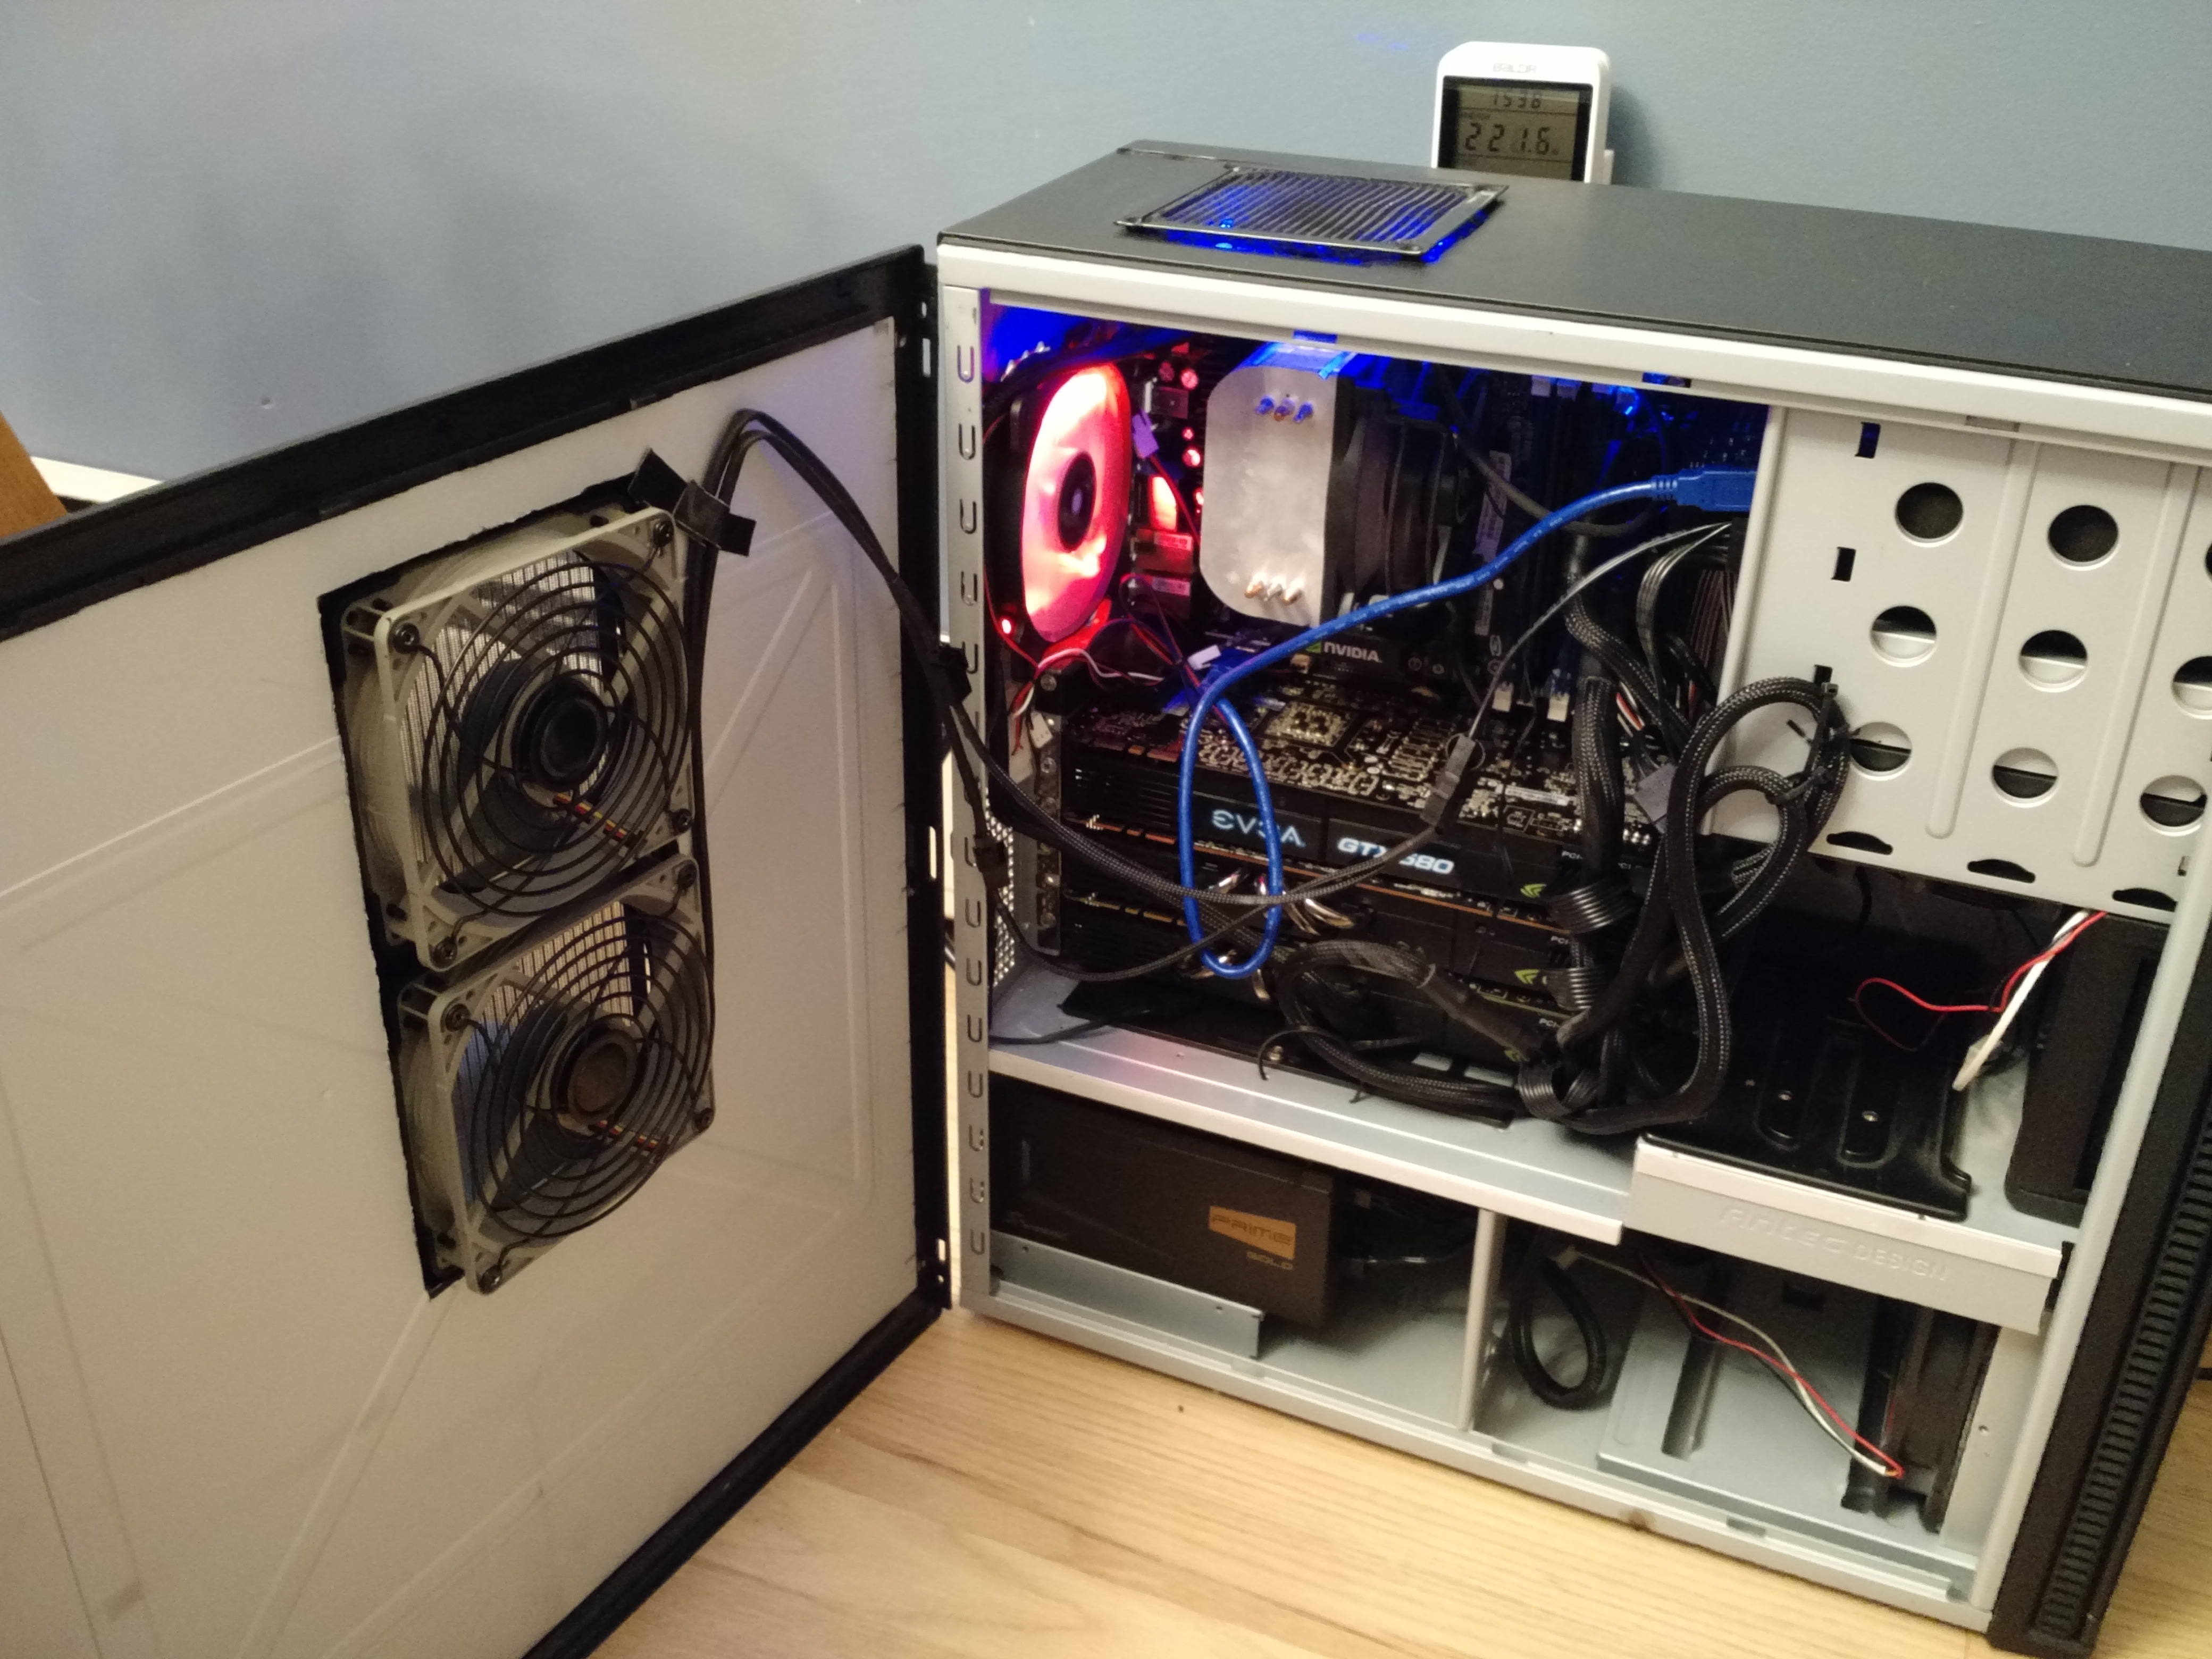
Here is a shot of the final build. It took a bit of tweaking to get it to this point.

F@H_Space_Heater_Quad_GPUs

Used Parts Disclaimer!

Note that when dealing with used parts on eBay, it’s always good to do some basic service. For the GPUs in this build, I took them apart, cleaned them, applied fresh thermal paste (Arctic MX-4), and re-assembled. It was good that I did…these cards were pretty gross, and the decade-old thermal paste was dried on from years of use.


I mean, come on now, look at the dust cake on the second GTX 480! Clean your graphics cards, random eBay people!

GTX 480 Dust

Here’s how the 3 + 1 GPUs are set up. The two GTX 480s and the GTX 580 are on the mobo in the X16 slots. I remotely mounted the GTX 460 in the drive bay. I used blower-style (slot exhaust) cards on purpose here, because they exhaust 100% of the hot air outside the case. Open-fan style cards would have overheated instantly in this setup.

To keep costs down, I just used Ubuntu Linux as the operating system. I configured the machine for 4-slot GPU folding using proprietary Nvidia drivers. Although I ultimately control all of my remote Linux machines with TeamViewer, it is helpful to have a portable monitor and combo wireless keyboard/mouse for initial configuration and testing. In the shot below (of an earlier config), I learned a lot just trying the get the machine stable with 3 cards.

Space_Heater_Early_Config_Initial_Fireup_small

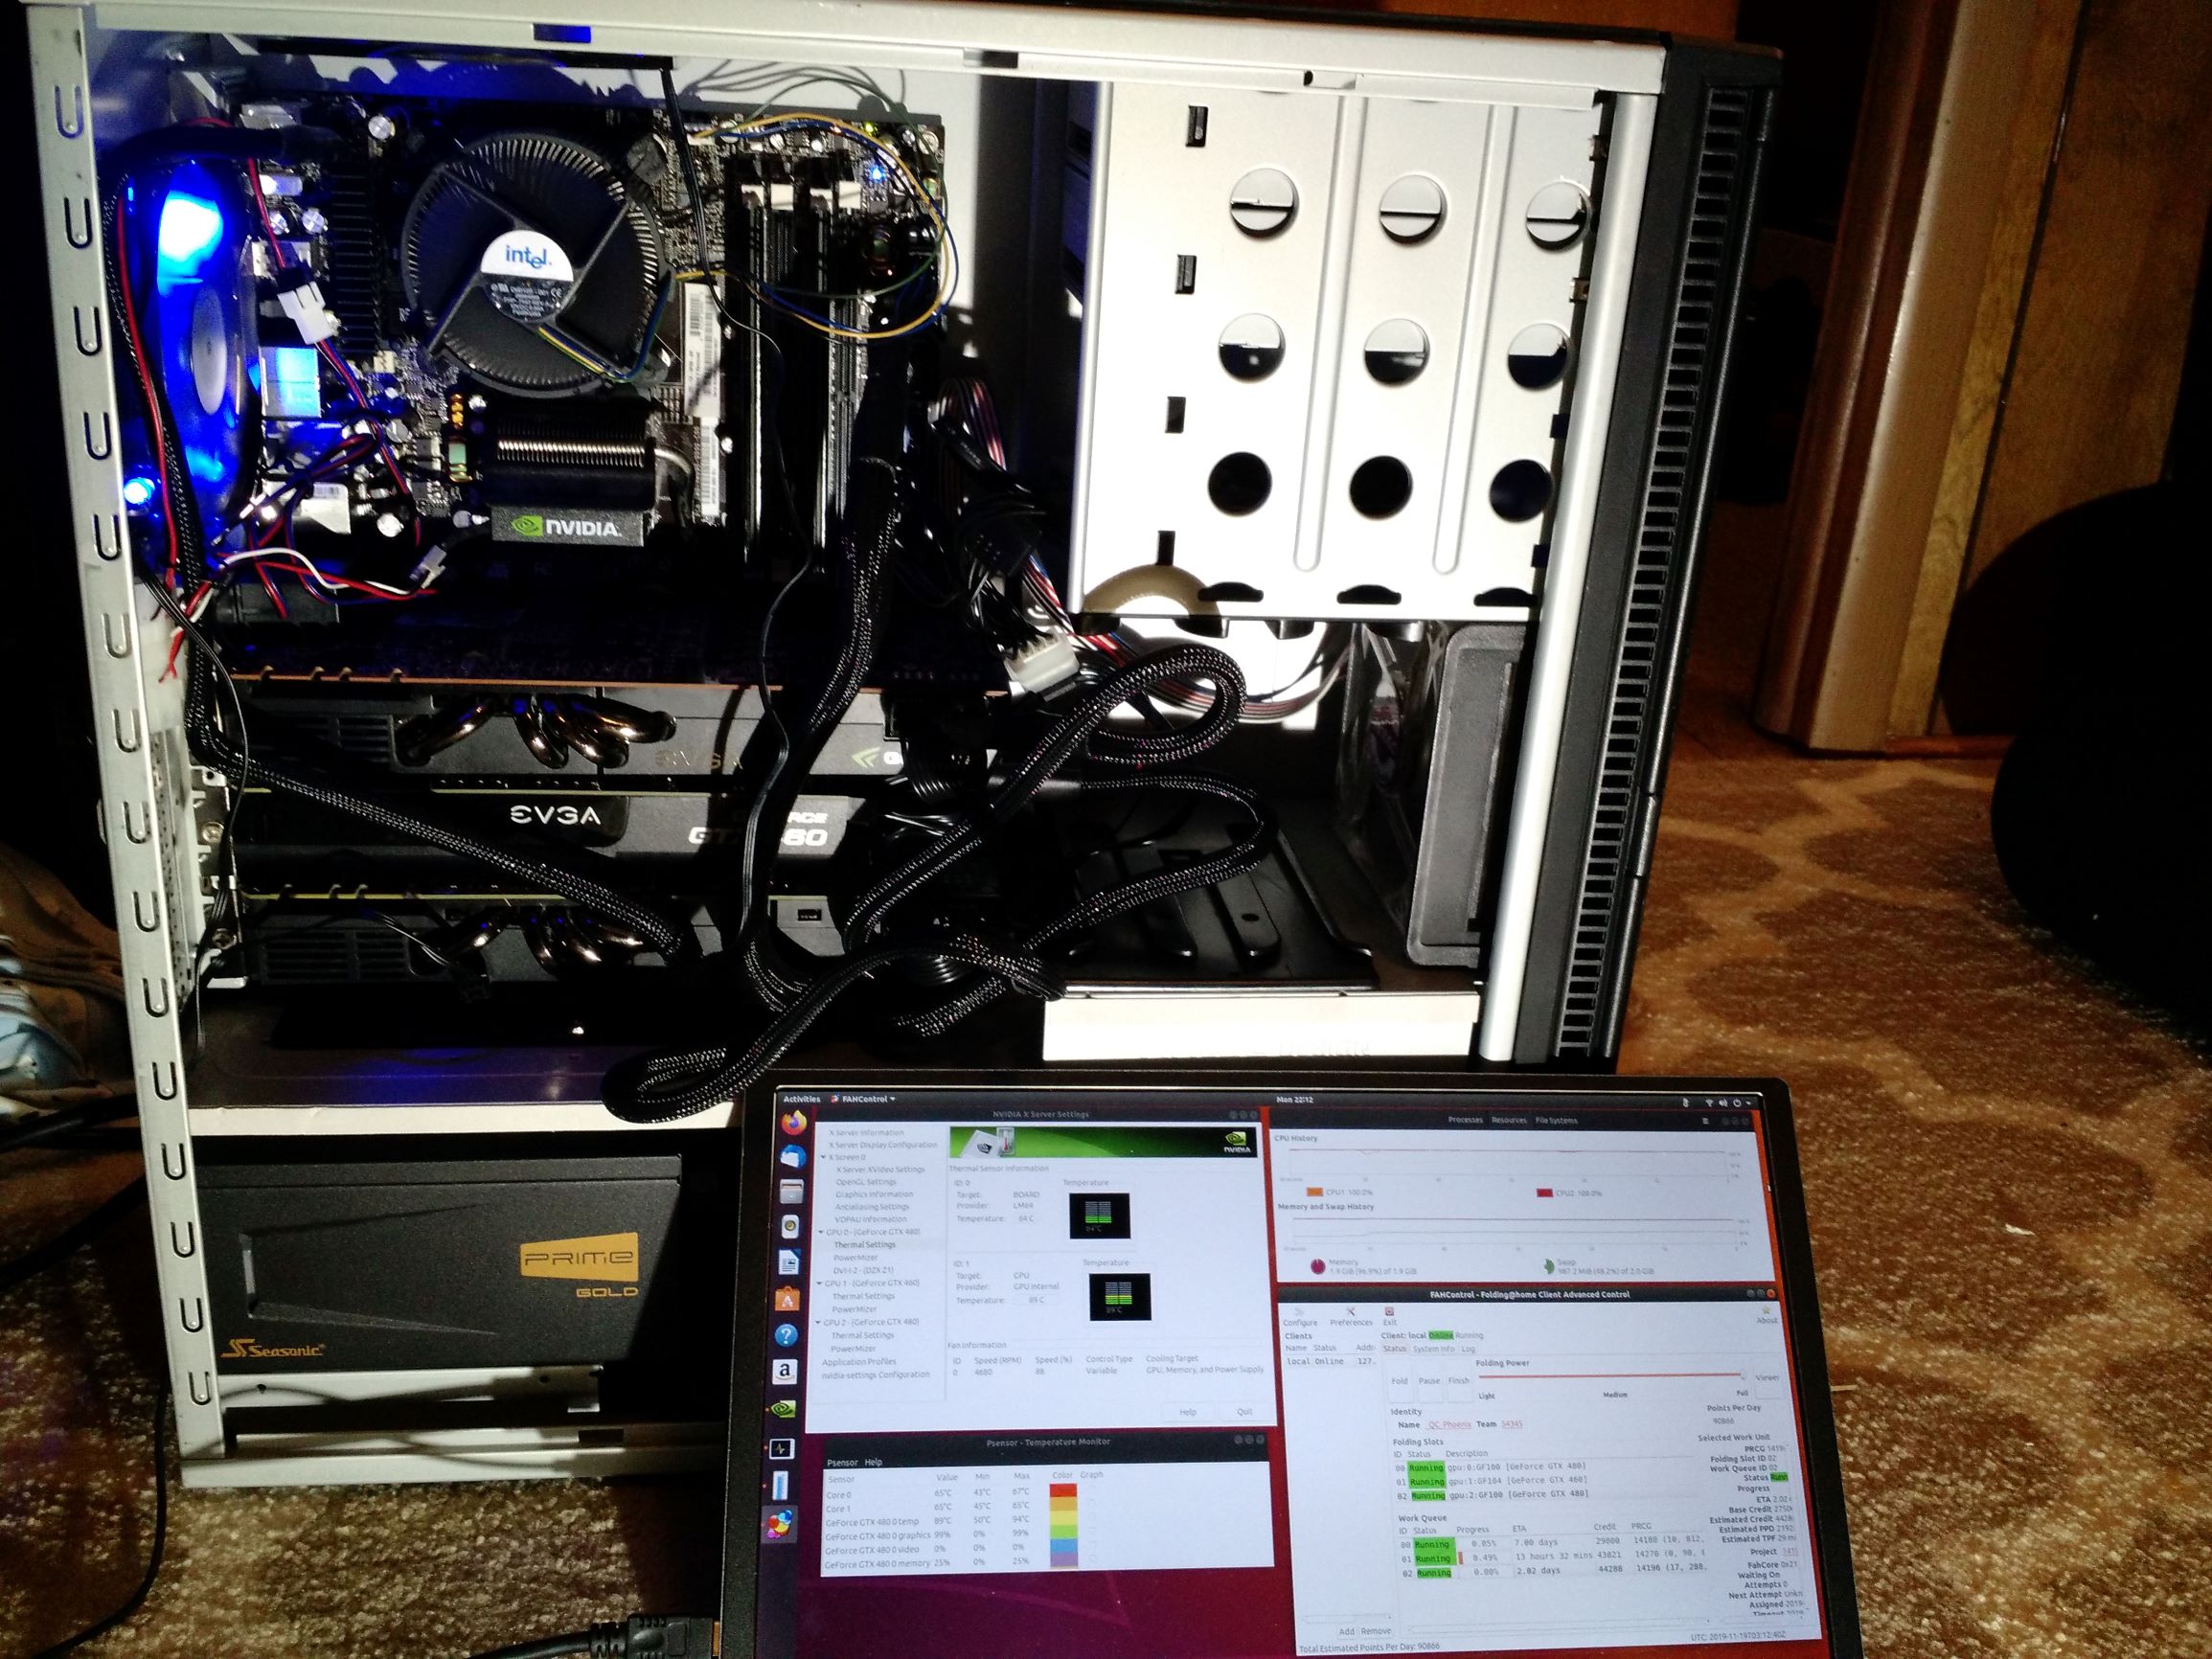
Initial Testing on the Space Heater (3 GPUs installed). This test showed me that I needed better CPU cooling (hence I chucked that stock Intel cooler)

I also did some thermal testing along the way to make sure things weren’t getting too hot. It turns out this testing was a bit misleading, because the system was running a lot cooler with the side panel off than with it on.

Some Thermal Camera Images During Initial Burn-In (3 GPUs, stock CPU cooler):

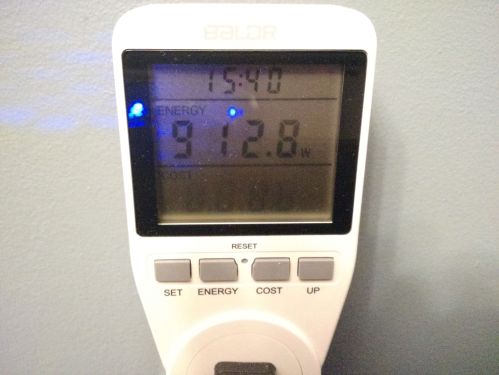
Now that’s some heat coming out of this beast! Thankfully, the upgraded 14-gauge power plug and my watt meter aren’t at risk of melting, although they are pretty warm.

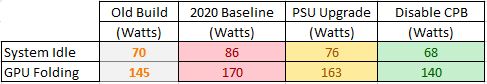
Once I had the machine up and running with all four GPUs the final configuration, I found that it produced about 55-95K PPD on average (based on the work unit), with the following breakdown

  • GTX 460: 10-20K PPD
  • GTX 480: 20-30K PPD each
  • GTX 580: 25-45 K PPD

Power consumption, as measured at the wall, ranged from 900 to 1000 watts with all 4 GPUs engaged. By turning different GPUs on and off, I could get varying levels of power (about 200 Watts idle. I typically ran it with one 580 and one 480 folding, for an average power consumption of about 600 watts).

Space_Heater_Power_Consumption

After running the machine for a while, my room was nice and toasty, as expected!

One thing that I should mention was the effect of the two additional intake fans that I mounted in the side panel. Originally I did not have these, and the top graphics card in the stack was hitting 97 degrees C according to the onboard monitoring! After modding this custom side-intake into the case (found a nice fan bracket on Amazon, and put my dremel tool to good use), the temps went down quite a lot. I used fan grilles on the inside of the fans to keep internal cables out of them, and mesh filters on the outside to match the intake filters on the rest of the case.


The top card stays under 85 degrees C (with the fan at 50%). The middle card stays under 80 degrees C, and the bottom card runs at 60 degrees C. The GTX 460 mounted in the drive bay never goes over 60 degrees C, but it’s a less powerful card and is mounted on the other side of the case.

Here’s some more pictures of the modded side panel, along with a little cooling diagram I threw together:

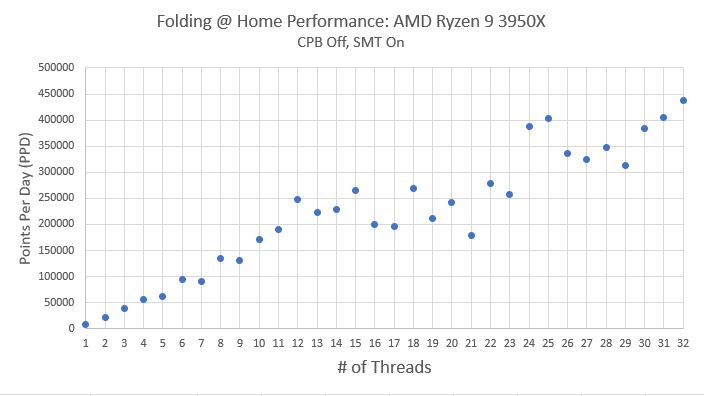
PPD, Wattage, and Efficiency Comparison

I debated about putting these plots in here, because the point of this machine was not primarily to make points (pun intended), or to be efficient from a PPD/Watt perspective. The point of this machine was to replace the 1500 watt space heater I use in the winter to keep a room warm.

As you can see, the scientific production (PPD) on this machine, even with 4 GPUs, is not all that impressive in 2020, since the GPUs being used are ten years old. Similarly, the efficiency (PPD/Watt) is terrible. There’s no surprise there, since it averages just under 1000 watts of power consumption at the wall!

Conclusion

It is totally possible to build a (relatively) inexpensive desktop computer out of old, used parts to use as a space heater. If the primary goal is to make heat, then this might not be a bad idea (although at $350, it still costs way more than a $20 heater from Walmart). The obvious benefit is that this sort of space heater is actually doing something useful besides keeping you warm (in this case, helping scientists learn more about diseases thanks to Folding@Home).

Other benefits that I found were the remote control (TeamViewer), which lets me use my cellphone to turn GPUs on and off to vary the heat output. Also, I think running this machine for extended durations in its medium-high setting (700 watts or so) is much healthier for the electrical wiring in my house vs. the constant cycling on and off of a traditional 1500 watt space heater.

From an environmental standpoint, you can do much worse than using electric heat. In my case, electric space heaters make a lot of sense, especially at night. I can shut off the entire heating zone (my house only has two zones) to the upstairs and just keep the bedroom warm. This drastically reduces my fossil fuel usage (good old New England, where home heating oil is the primary method of keeping warm in the winter). Since my house has an 8.23 KW solar panel array on the roof, a lot of my electricity comes directly from the sun, making this electric heat solution even greener.

Parting Thoughts:

I would not recommend running a machine like this during the warmer months. If warm air is not wanted, all the waste heat from this machine will do nothing but rack up your power bill for relatively little science being done. If you want to run an efficient summer-time F@H rig that uses low power (so as to not fight your AC) , check out my article on the GTX 1660 and 1650.

In a future article, I plan to show how I actually saved on heating costs by running Folding@Home space heaters all last winter (with a total of seven Folding@Home desktops placed strategically throughout my house, so that I hardly had to burn any oil).


AMD Ryzen 9 3950X Folding@Home Review: Part 1: PPD vs # of Threads

Welcome back everyone. Over the last month, I’ve been experimenting with my new Folding@Home benchmark machine to see how effectively AMD’s flagship Ryzen processor (Ryzen 9 3950X) can fight diseases such as COVID-19, Cancer, and Alzheimer’s. I’ve been running Folding@Home, a charitable distributed computing project, which provides scientists with valuable computing resources to study diseases and learn how to combat them.

This blog is typically focused on energy efficiency, where I try to show how to do the most science for the least amount of power consumption possible. In this post, I’m stepping away from that (at least for now) in order to understand something much simpler: how does the Folding@Home CPU client scale with # of processor threads?

I’d previously investigated Folding@Home performance and efficiency vs. # of CPU cores on an old Intel Q6600. I’ve also done a few CPU articles on AMD’s venerable Phenom II X6 1000T and my previous processor, the AMD FX-8320e. These CPU articles were few and far-between however, as I typically focus on using graphics cards (GPUs). The reason is twofold. Historically, graphics cards have produced many more points per day (PPD) for a given amount of power, thanks to their massively parallel architecture, which is well-suited for running single precision molecular dynamics problems such as those used by Folding@Home. Also, graphics cards are much easier to swap out, so it was relatively easy to make a large database of GPU performance and efficiency.

Still, CPU folding is just as important, because there are certain classes of problems that can only be efficiently computed on the CPU. Folding@Home, while originally a project that ran exclusively on CPUs, obtains the bulk of its computational power from GPU donors these days. However, the CPU folders sill play a key part, running work units that cannot be solved on GPUs, thus providing a complete picture of the molecular dynamics.

In my last article, I highlighted the need for me to build a new benchmark machine for testing out GPUs, since my old rig would soon become a bottleneck and slow the GPUs down (thus potentially affecting any comparison plots I make). Now that this Ryzen-based 16-core monster of a desktop is complete, I figured I’d revisit CPU folding once more to see just what a modern enthusiast-class processor like the $749 Ryzen 9 3950X is capable of. For this first part of a multi-part review, I am simply looking at the preliminary results from running Folding@Home on the CPU. Instead of running with the default thread settings, I manually set up the client, examining just how performance results scale from the 1 to 32 available threads on the Ryzen 9 3950x.

Test Setup

Testing was performed in Windows 10 Home, using the latest Folding@Home client (7.6.13). Points Per Day were estimated from the client window for each setting of # of CPU threads. These instantaneous estimates have a lot of variability, so future testing will investigate the effect of averaging (running multiple tests at each setting) on the results.

Benchmark Machine Hardware:

Case Raidmax Sagitta (2006)
Power Supply Seasonic Prime 750 Titanium
Fresh Air 2 x 120 mm Enermax Front Intake
Rear Exhaust 1 x 120 mm Scythe Gentile Typhoon
Side Exhaust 1 x 80 mm Noctua
Top Exhaust 1 x 120 mm (Seasonic PSU)
CPU Cooler Noctua NH-D15 SE AM4
Thermal Paste Arctic MX-4
CPU AMD Ryzen 9 3950X 16 Core 32 Thread (105W TDP)
Motherboard ASUS Prime X570-P Socket AM4
Memory 32 GB (4 x 8 GB) Corsair Vengeance LPX DDR4 3600 MHz
GPU Zotac Nvidia GeForce 1650
OS Drive Samsung 970 Evo Plus 512 GB NVME SSD
Storage #1 Samsung 860 Evo 2 TB SSD
Storage #2 Western Digital Blue 256 GB NVME SSD (for Linux)
Optical Samsung SH-B123L Blu-Ray Drive
OS Windows 10 Home, Ubuntu Linux (on 2nd NVME)

Processor Settings:

The AMD Ryzen 9 3950x is a beast. With 16 cores and 32 threads, it has a nominal power consumption of 105 watts, but can easily double that when overclocked. With the factory Core Performance Boost (CPB) enabled, the processor will routinely draw 150+ watts when loaded due to the individual cores turboing as high as 4.7 GHz, up from the 3.5 GHz base clock. Under heavy multi-threaded work loads, the processor supports an all-core overclock of up to 4.3 GHz, assuming sufficient cooling and motherboard power delivery.

This automatic core turbo behavior is problematic for creating a plot of folding at home performance (PPD) vs # of threads, since for lightly threaded loads, the processor will scale up individual cores to much higher speeds. In order to make an apples to apples comparison, I disabled CPB, so that all CPU cores run at the base speed of 3.5 GHz when loaded. In future testing, I will perform this study with CPB on in order to see the effect of the factory automatic overclocking.

A note about Cores vs. Threads

Like many Intel processors with Hyper-Threading, AMD supports running multiple code execution strings (known as threads) on one CPU core. The Simultaneous Multi-Threading (SMT) on the Ryzen 9 3950x is simply AMD’s term for the same thing: a doubling of certain parts within each processor core (or sometimes the virtualization of multiple threads within one CPU core) to allow multiple thread execution (two threads per core, in this case). The historical problem with both Hyper-Threading and SMT is that it does not actually double a CPU core’s capacity to perform complex floating point mathematics, since there is only one FPU per CPU core. SMT and Hyperthreading work best when there is one large job hogging a core, and the smaller job can execute in the remaining part of the core as a second thread. Two equally intensive threads can end up competing for resuorses within a core, making the SMT-enabled processor actually slower. For example: https://www.techspot.com/review/1882-ryzen-9-smt-on-vs-off/

For the purposes of this article, I left SMT on in order to make the coolest plot possible (1-32 threads!). However, I suspect that SMT might actually hurt Folding@Home performance, for the reasons mentioned above. Thus in future testing, I will also try disabling this to see the effect.

Preliminary Results: PPD vs # Threads on Ryzen 9 3950x

So, to summarize the caveats, this test was performed once under each test condition (# of threads), so there are 32 data points for 32 threads. SMT was on (so Folding@Home can run two threads on one CPU core). CPB was off (all cores set to 3.5 GHz).

The figure below shows the results. As you can see, there is a general trend of increasing performance with # of threads, up to around the halfway point. Then, the trend appears to get messy, although by the end of the plot, it is clear that the higher thread counts realize a higher PPD.

Ryzen 9 3950X PPD vs Thread Count 1

Observations

It is clear that, at least initially, adding threads to the solution makes a fairly linear improvement in points per day. Eventually, however, the CPU cores are likely becoming saturated, and more of the work is being executed in via SMT. Due to the significant work unit variability in Folding@Home (as much as 10-20% between molecules), these results should be taken with a grain of salt. I am currently re-running all of these tests, so that I can show a plot of average PPD vs. # of Threads. I am also logging power using my watt meter, so that we can make wall power consumption and efficiency plots.

Conclusions

Seeing a processor produce nearly half a million points per day in Folding@Home was insane! My previous testing with old 4, 6, and 8-core processors was lucky to show numbers over 20K PPD. In general, allowing Folding@Home to use more processor threads increases performance, but there is significant additional work needed to verify a statistical trend. Stay tuned for Part II (averaging).

P.S.

Man, that’s a lot of cores! You’d better be scared, COVID-19…I’m coming for you!

Cores!

So Many Cores!

Ryzen Update / Consider Supporting my Writing (somewhat off topic)

For those following along, it might be a bit until I get the next article published on testing out CPU folding on the Ryzen 3950x. I’m doing a # of threads vs. PPD and PPD/Watt efficiency plot, but with 32 threads this will take a while. I’m running a minimum of 3 work units per test, to try and minimize the work unit variation. I also want to do this with and without hyper threading (SMT) on, to see the effect. So far, I’m seeing PPD of up to 400K, which is insane for a CPU!

In the mean time, I’m working on my other writing projects. For anyone who likes science-fiction, you can check out my free online web novel The Chronicles of the Starfighters over on Royal Road. You can also check out my books Sagitta and Hrain on Amazon. These are pulpy, science-fiction adventure stories (think Star Trek or Star Wars) with a teenage and / or alien protagonists. It’s a far cry from the non-fiction posts of this blog, but it is equally nerdy, I promise.

For those interested in supporting this blog, giving Chronicles a review or rating on Royal Road would be a great way to help me gain traction (honest reviews only please, I’m looking for feedback on what I can improve as well as what I do well).

Starfighter Promo

You can read more about my sci-fi writing projets at my other blog: https://starfightersf.com/

Finally, since I don’t have a Patreon (yet), anyone interested in donating to help me fund more graphics card purchases can consider buying a kindle book. Even if you don’t enjoy science fiction, you can gift copies to someone who does!

Kindle book links:

Sagitta (story about a human warp ship that changes the course of an alien war)

Hrain (story about a young telepathic alien who beats people up and stuff)

Thanks! And hopefully I’ll have that Ryzen data up soon.

-Chris

New Folding@Home Benchmark Machine: It’s RYZEN TIME!

Folding@Home, the distributed computing project that fights diseases such as COVID-19 and cancer, has hit an all-time high in popularity. I’m stunned to find that my blog is now getting more views every day than it did every month last year. With that said, this is a perfect opportunity to reach out and see if all the new donors are interested in tuning their computers for efficiency, to save a little on power, lighten the burden on your wallet, and hopefully produce nearly the same amount of science. If this sounds interesting to you, let me know in the comments below!

In my last post, I noted that the latest generation of graphics cards are starting to push the limits of what my primary GPU Folding@Home benchmark rig can do. That computer is based on an 11-year-old chipset (AMD 880), and only supports PCI-Express 2.0. In order for me to keep testing modern fast graphics cards in Windows 10, I wanted to make sure that PCI-Express slot bandwidth wasn’t going to artificially bottleneck me.

So, without further ado, let me present the new, re-built Folding@Home rig, SAGITTA:

Sagitta Desktop

I’ve (re)created a monster!

This build leverages the Raidmax Sagitta case that I’ve had since 2006. This machine has hosted multiple builds (Pentium D 805, Core 2 Duo e8600, Core 2 Quad Q6600, Phenom II X6 1100T, and the most recent FX-8320e Bulldozer). There have been too many graphics cards to count, but the latest one (Nvidia GTX 1650 by Zotac) was carried over for some continuity testing. The case fans and power supply (initially) were also the same since the previous FX build (they aren’t the same ones from back in 2006…those got loud and died long ago). I also kept my Blu-Ray drive and 3.5 inch card reader. That’s where the similarities end. Here is a specs comparison:

Sagitta Rebuild Benchmark Machine Specs

  • Note I ended up updating the power supply to the one shown in the table. More on that below…

System Power Consumption

Initially, the power consumption at idle of the new Ryzen 9 build, measured with my P3 Kill A Watt Meter, was 86 watts. The power consumption while running GPU Folding was 170 watts (and the all-core CPU folding was over 250 watts, but that’s another article entirely).

Using the same Nvidia GeForce GTX 1650 graphics card, these idle and GPU folding power numbers were unfortunately higher than the old benchmark machine, which came in at 70 watts idle and 145 watts load. This is likely due to the overkill hardware that I put into the new rig (X570 motherboards alone are known to draw twice the power of a more normal board). The system’s power consumption difference of 25 watts while folding was especially problematic for my efficiency testing, since new plots compared to graphics cards tested on the old benchmark machine would not be comparable.

To solve this, I could either:

A: Use a 25 watt offset to scale the new GPU F@H efficiency plots

B: Do nothing and just have less accurate efficiency comparisons to previous tests

C: Reduce the power consumption of the new build so that it matches the old one

This being a blog about energy efficiency, I decided to go with Option C, since that’s the one that actually helps the environment. Lets see if we can trim the fat off of this beast of a computer!

Efficiency Boost #1: Power Supply Upgrade

The first thing I tried was to upgrade the power supply. As noted here, the power supply’s efficiency rating is a great place to start when building an energy efficient machine. My old Seasonic X-650 is a very good power supply, and caries an 80+ Gold rating. Still, things have come a long way, and switching to an 80+ Titanium PSU can gain a few efficiency percentage points, especially at low loads.

80+ Table

80+ Efficiency Table

With that 3-5% efficiency boost in mind, I picked up a new Seasonic 750 Watt Prime 80+ Titanium modular power supply. At $200, this PSU isn’t cheap, but it provides a noticeable efficiency improvement at both idle and load. Other nice features were the additional 100 watts of capacity, and the fact that it supported my new motherboard’s dual pin (8 + 4) CPU aux power connection. That extra 4-pin isn’t required to make the X570 board work, but it does allow for more overclocking headroom.

Disclaimer: Before we get into it, I should note that these power readings are “eyeball” readings, taken by glancing at the watt meter and trying to judge the average usage. The actual number jumps around a bit (even at idle) as the computer executes various background tasks. I’d say the measurement precision on any eyeball watt meter readings is +/- 5 watts, so take the below with a grain of salt. These are very small efficiency improvements that are difficult to measure, and your mileage may vary. 

After upgrading the power supply, idle power dropped an impressive 10 watts, from 86 watts to 76. This is an awesome 11% efficiency improvement. This might be due to the new 80+ Titanium power supply having an efficiency target at very low loads (90% efficiency at 10% load), whereas the old 80+ Gold spec did not have a low load efficiency requirement. Thus, even though I used a large 750 watt power supply, the machine can still remain relatively efficient at idle.

Under moderate load (GPU folding), the new 80+ titanium PSU provided a 4% efficiency improvement, dropping the power consumption from 170 watts to 163. This is more in line with expectations.

Efficiency Boost #2: Processor Underclock / Undervolt

Thanks to video gaming mentality, enthusiast-grade desktop processors and motherboards are tuned out of the box for performance. We’re talking about blistering fast, competition-crushing benchmark scores. For most computing tasks (such as running Folding@Home on a graphics card), this aggressive CPU behavior is wasting electricity while offering no discernible performance benefit. Despite what my kid’s shirt says, we need to reel these power hungry CPUs in for maximum GPU folding efficiency.

Never Slow Down

Kai Says: Never Slow Down

One way to improve processor efficiency is to reduce the clock rate and associated voltage. I’d previously investigated this here. It takes exponentially more voltage to support high frequencies, so just by dropping the clock rate by 100 MHz or so, you can lower the voltage a bunch and save on power.

With the advent of processors that up-clock and up-volt themselves (as well as going in the other direction), manual tuning can be a bit more difficult. It’s far easier to first try the automatic settings, to see if some efficiency can be gained.

But wait, this is a GPU folding benchmark rig? Why does the CPU’s frequency and power settings matter?

For GPU folding with an Nvidia graphics card, one CPU core is fully loaded per GPU slot in order to “feed” the card. This is because Nvidia’s implementation of open CL support using a polling (checking) method. In order to keep the graphics card chugging along, the CPU constantly checks on the GPU to see if it needs any data. This polling loop is not efficient and burns unnecessary power. You can read more about it here: https://foldingforum.org/viewtopic.php?f=80&t=34023. In contrast, AMD’s method (interrupts) is a much more graceful implementation that doesn’t lock up a CPU core.

The constant polling loop drives modern gaming-oriented processors to clock up their cores unnecessarily. For the most part, the GPU does not need work at every waking moment. To save power, we can turn down the frequency, so that the CPU is not constantly knocking on the GPU’s metaphorical door.

To do this, I disabled AMD’s Core Performance Boost (CPB) in the AMD Overclocking section of the BIOS (same thing as Intel’s Turbo Boost). This caps the processor speed at the base maximum clock rate (3.5 GHz for the Ryzen 9 3950x), and also eliminates any high voltage values required to support the boost clocks.

Success! GPU folding total system power consumption is now much lower. With less superfluous power draw from the CPU, the wattage is much more comparable to the old Bulldozer rig.

Ryzen 9 3950x Power Reduction Table

It is interesting that idle power consumption came down as well. That wasn’t expected. When the computer isn’t doing anything, the CPU cores should be down-clocked / slept out. Perhaps my machine was doing something in the background during the earlier tests, thus throwing the results off. More investigation is needed.

GPU Benchmark Consistency Check

I fired up GPU folding on the Nvidia GeForce GTX 1650, a card that I have performance data for from my previous benchmark desktop. After monitoring it for a week, the Folding@Home Points Per Day performance was so similar to the previous results that I ended up using the same value (310K PPD) as the official estimate for the 1650’s production. This shows that the old benchmark rig was not a bottleneck for a budget card like the GeForce GTX 1650.

Using the updated system power consumption of nominally 140 watts (vs 145 watts of the previous benchmark machine), the efficiency plots (PPD/Watt) come out very nearly the same. I typically consider power measurements of + / – 5 watts to be within the measurement accuracy of my eyeball on the watt meter anyway, due to normal variations as the system runs. The good news is that even with this variation, it doesn’t change the conclusion of the figure (in terms of graphics card efficiency ranking).

GTX 1650 Efficiency on Ryzen 9

* Benchmark performed on updated Ryzen 9 build

Conclusion

I have a new 16-core beast of a benchmark machine. This computer wasn’t built exclusively for efficiency, but after a few tweaks, I was able to improve energy efficiency at low CPU loads (such as Windows Idle + GPU Folding).

For most of the graphics cards I have tested so far, the massive upgrade in system hardware will not likely affect performance or efficiency results. Very fast cards, such as the 1080 Ti, might benefit from the new benchmark rig’s faster hardware, especially that PCI-Express 4.0 x16 graphics card slot. Most importantly, future tests of blistering fast graphics cards (2080 Ti, 3080 Ti, etc) will probably not be limited by the benchmark machine’s background hardware.

Oh, I can also now encode my backup copies of my blu-ray movies at 40 fps in H.265 in Handbrake (old speed was 6.5 fps on the FX-8320e). That’s a nice bonus too.

Efficiency Note (for GPU Folding@Home Users)

Disabling the automatic processor frequency and voltage scaling (Turbo Boost / Core Performance Boost) didn’t have any effect on the PPD being generated by the graphics card. This makes sense; even relatively slow 2.0 GHz CPU cores are still fast enough to feed most GPUs, and my modern Ryzen 9 at 3.5 GHz is no bottleneck for feeding the 1650. By disabling CPB, I shaved 23 watts off of the system’s power consumption for literally no performance impact while running GPU folding. This is a 16 percent boost in PPD/Watt efficiency, for free!

This also dropped CPU temps from 70 degrees C to 55, and resulted in a lower CPU cooler fan speed / quieter machine. This should promote longevity of the hardware, and reduce how much my computer fights my air conditioning in the summer, thus having a compounding positive effect on my monthly electric bill.

Future Articles

  • Re-Test the 1080 Ti to see if a fast graphics card makes better use of the faster PCI-Express bus on the AM4 build
  • Investigate CPU folding efficiency on the Ryzen 9 3950x


Shout out to the helpers…Kai and Sam

Folding@Home on Turing (NVidia GTX 1660 Super and GTX 1650 Combined Review)

Hey everyone. Sorry for the long delay (I have been working on another writing project, more on that later…). Recently I got a pair of new graphics cards based on Nvidia’s new Turing architecture. This has been advertised as being more efficient than the outgoing Pascal architecture, and is the basis of the popular RTX series Geforce cards (2060, 2070, 2080, etc). It’s time to see how well they do some charitable computing, running the now world-famous disease research distributed computing project Folding@Home.

Since those RTX cards with their ray-tracing cores (which does nothing for Folding) are so expensive, I opted to start testing with two lower-end models: the GeForce GTX 1660 Super and the GeForce GTX 1650.


These are really tiny cards, and should be perfect for some low-power consumption summertime folding. Also, today is the first time I’ve tested anything from Zotac (the 1650). The 1660 super is from EVGA.

GPU Specifications

Here’s a quick table I threw together comparing these latest Turing-based GTX 16xx series cards to the older Pascal lineup.

Turing GPU Specs

It should be immediately apparent that these are very low power cards. The GTX 1650 has a design power of only 75 watts, and doesn’t even need a supplemental PCI-Express power cable. The GTX 1660 Super also has a very low power rating at 125 Watts. Due to their small size and power requirements, these cards are good options for small form factor PCs with non-gaming oriented power supplies.

Test Setup

Testing was done in Windows 10 using Folding@Home Client version 7.5.1. The Nvidia Graphics Card driver version was 445.87. All power measurements were made at the wall (measuring total system power consumption) with my trusty P3 Kill-A-Watt Power Meter. Performance numbers in terms of Points Per Day (PPD) were estimated from the client during individual work units. This is a departure from my normal PPD metric (averaging the time-history results reported by Folding@Home’s servers), but was necessary due to the recent lack of work units caused by the surge in F@H users due to COVID-19.

Note: This will likely be the last test I do with my aging AMD FX-8320e based desktop, since the motherboard only supports PCI Express 2.0. That is not a problem for the cards tested here, but Folding@Home on very fast modern cards (such as the GTX 2080 Ti) shows a modest slowdown if the cards are limited by PCI Express 2.0 x16 (around 10%). Thus, in the next article, expect to see a new benchmark machine!

System Specs:

  • CPU: AMD FX-8320e
  • Mainboard : Gigabyte GA-880GMA-USB3
  • GPU: EVGA 1080 Ti (Reference Design)
  • Ram: 16 GB DDR3L (low voltage)
  • Power Supply: Seasonic X-650 80+ Gold
  • Drives: 1x SSD, 2 x 7200 RPM HDDs, Blu-Ray Burner
  • Fans: 1x CPU, 2 x 120 mm intake, 1 x 120 mm exhaust, 1 x 80 mm exhaust
  • OS: Win10 64 bit

Goal of the Testing

For those of you who have been following along, you know that the point of this blog is to determine not only which hardware configurations can fight the most cancer (or coronavirus), but to determine how to do the most science with the least amount of electrical power. This is important. Just because we have all these diseases (and computers to combat them with) doesn’t mean we should kill the planet by sucking down untold gigawatts of electricity.

To that end, I will be reporting the following:

Net Worth of Science Performed: Points Per Day (PPD)

System Power Consumption (Watts)

Folding Efficiency (PPD/Watt)

As a side-note, I used MSI afterburner to reduce the GPU Power Limit of the GTX 1660 Super and GTX 1650 to the minimum allowed by the driver / board vendor (in this case, 56% for the 1660 and 50% for the 1650). This is because my previous testing, plus the results of various people in the Folding@Home forums and all over, have shown that by reducing the power cap on the card, you can get an efficiency boost. Let’s see if that holds true for the Turing architecture!

Performance

The following plots show the two new Turing architecture cards relative to everything else I have tested. As can be seen, these little cards punch well above their weight class, with the GTX 1660 Super and GTX 1650 giving the 1070 Ti and 1060 a run for their money. Also, the power throttling applied to the cards did reduce raw PPD, but not by too much.

Nvidia GTX 1650 and 1660 performance

Power Draw

This is the plot where I was most impressed. In the summer, any Folding@Home I do directly competes with the air conditioning. Running big graphics cards, like the 1080 Ti, causes not only my power bill to go crazy due to my computer, but also due to the increased air conditioning required.

Thus, for people in hot climates, extra consideration should be given to the overall power consumption of your Folding@Home computer. With the GTX 1660 running in reduced power mode, I was able to get a total system power consumption of just over 150 watts while still making over 500K PPD! That’s not half bad. On the super low power end, I was able to beat the GTX 1050’s power consumption level…getting my beastly FX-8320e 8-core rig to draw 125 watts total while folding was quite a feat. The best thing was that it still made almost 300K PPD, which is well above last generations small cards.

Nvidia GTX 1650 and 1660 Power Consumption

Efficiency

This is my favorite part. How do these low-power Turing cards do on the efficiency scale? This is simply looking at how many PPD you can get per watt of power draw at the wall.

Nvidia GTX 1650 and 1660 Efficiency

And…wow! Just wow. For about $220 new, you can pick up a GTX 1660 Super and be just as efficient than the previous generation’s top card (GTX 1080 Ti), which still goes for $400-500 used on eBay. Sure the 1660 Super won’t be as good of a gaming card, and it  makes only about 2/3’s the PPD as the 1080 Ti, but on an energy efficiency metric it holds its own.

The GTX 1650 did pretty good as well, coming in somewhere towards the middle of the pack. It is still much more efficient than the similar market segment cards of the previous generation (GTX 1050), but it is overall hampered by not being able to return work units as quickly to the scientists, who prioritize fast work with bonus points (Quick Return Bonus).

Conclusion

NVIDIA’s entry-level Turing architecture graphics cards perform very well in Folding@Home, both from a performance and an efficiency standpoint. They offer significant gains relative to legacy cards, and can be a good option for a budget Folding@Home build.

Join My Team!

Interested in fighting COVID-19, Cancer, Alzheimer’s, Parkinson’s, and many other diseases with your computer? Please consider downloading Folding@Home and joining Team Nuclear Wessels (54345). See my tutorial here.

Interested in Buying a GTX 1660 or GTX 1650?

Please consider supporting my blog by using one of the below Amazon affiliate search links to find your next card! It won’t cost you anything extra, but will provide me with a small part of Amazon’s profit so I can keep paying for this site.

GTX 1660 Amazon Search Affiliate Link!

GTX 1650 Amazon Search Affiliate Link!