Monthly Archives: April 2017

Folding@Home Performance on a Budget: Nvidia GeForce GTX 1050 TI

With the release of Nvidia’s new Pascal architecture, the world of computational computing has become a lot more interesting.  Based on a 14 nm process, the GTX 10XX series of graphics cards have set records for power efficiency.  Today, we’ll be looking at the Geforce GTX 1050 TI in terms of Folding@home performance and efficiency.

Nvidia GTX 1050 TI Overview

The GTX 1050 TI is the second from the lowest-end Pascal card (there is a non-TI version with slightly fewer active cores).  One of the most attractive features about this card is its relatively low price ($130 for the EVGA SC version being reviewed here today).  In addition, this card does not require any external power connections, being supplied by the PCI Express slot power alone (about 70 watts).  Online review websites have raved about this card’s impressive gaming potential, small size, and overall efficiency.

Specs (EVGA 1050 TI SC):

Performance

  • NVIDIA GTX 1050 Ti
  • 768 Pixel Pipelines
  • 1354 MHz Base Clock
  • 1468 MHz Boost Clock
  • 65GT/s Texture Fill Rate

Memory

  • 4096 MB, 128 bit GDDR5
  • 7008 MHz (effective)
  • 112.16 GB/s Memory Bandwidth

Interface

  • PCI-E 3.0 16x
  • DVI-D, DisplayPort, HDMI
  • Total Power Draw : 75 Watts

Folding@Home Test Setup

For this test, I swapped out the Radeon 7970 in my gaming computer for the GTX 1050 TI. The first thing I noticed was the incredible size difference between these two cards.  Of course it’s a bit of an apples to oranges comparison…the 7970 is an old top of the line graphics card, whereas the 1050 is a lightweight, entry-level gaming card.

Size Comparison (is bigger always better?  We’ll find out):

Graphics Card Showdown: EVGA Nvidia Geforce GTX 1050 TI vs. Gigabyte AMD Radeon HD 7970 GHz Edition

Graphics Card Showdown: EVGA Nvidia Geforce GTX 1050 TI vs. Gigabyte AMD Radeon HD 7970 GHz Edition

Testing was done using Stanford’s V7 client on Windows 7 64-bit running FAH Core 21 work units.  The video driver version used was 381.65.  All power consumption measurements were taken at the wall and are thus full system power consumption numbers.

If you’re interested in reading about the hardware configuration of my test rig, it is summarized in this post:

https://greenfoldingathome.com/2017/04/21/cpu-folding-revisited-amd-fx-8320e-8-core-cpu/

Information on my watt meter readings can be found here:

I Got a New Watt Meter!

Folding@Home Test Results – 192K PPD and 1400 PPD/Watt!

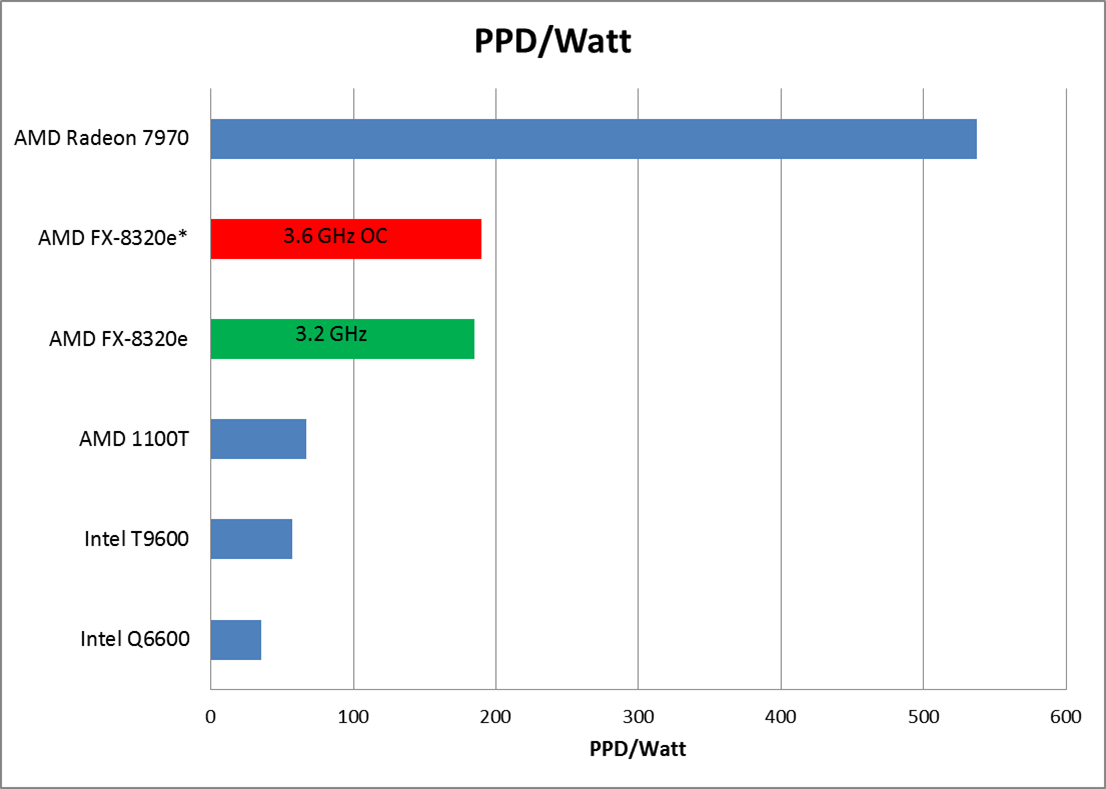
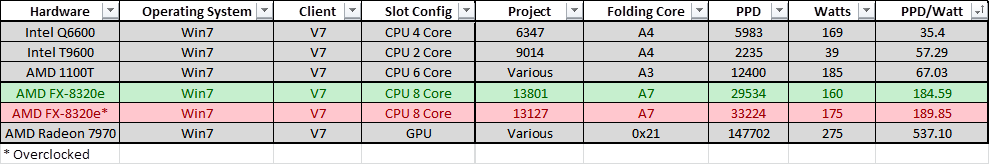
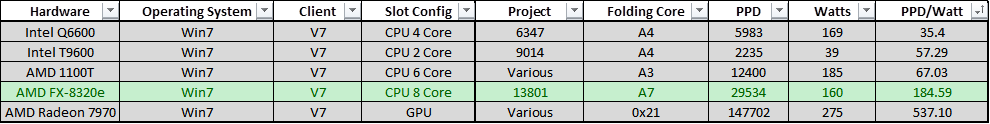
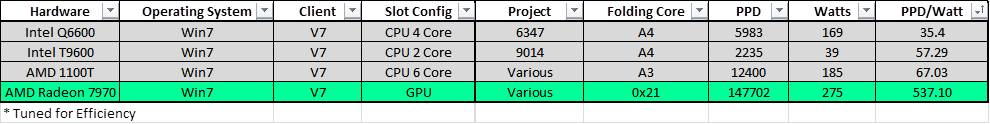
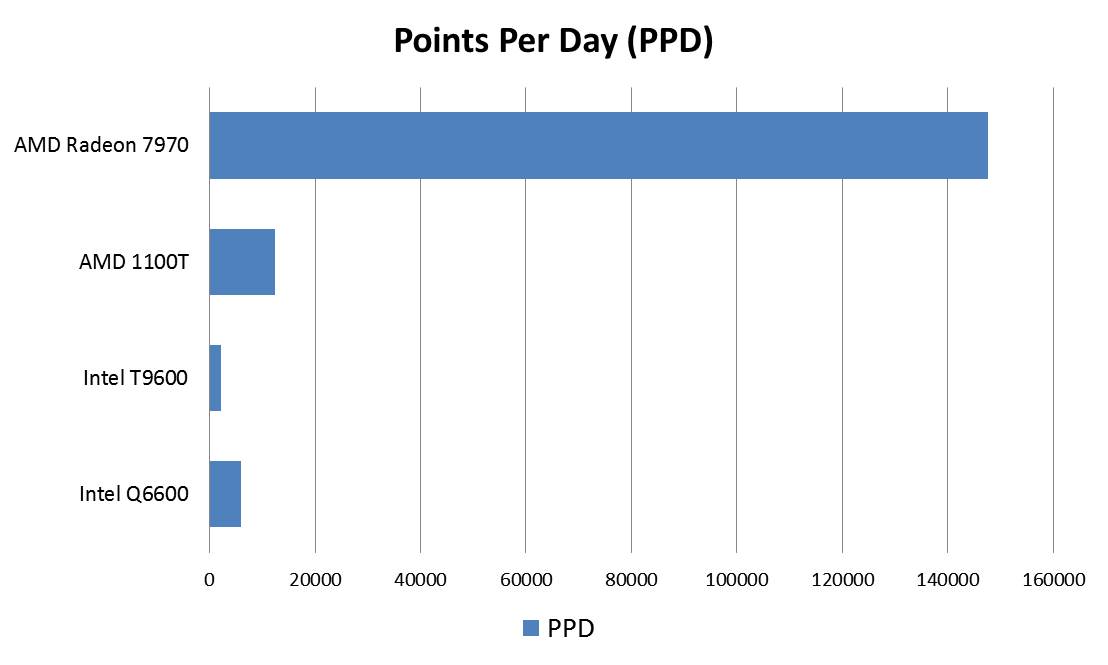
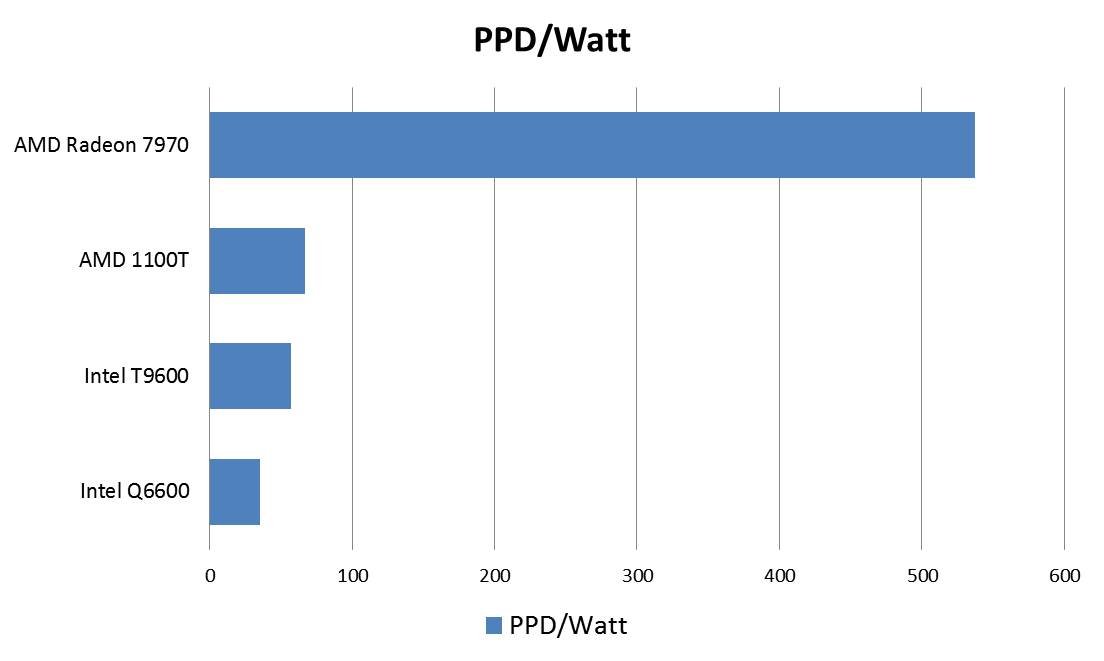
One of the recurring themes of this blog is that using new, basic hardware to run Folding@home often leads to much better performance and energy efficiency than running on dated high-end hardware.  The results here sum that up nicely.  As you can see, the Nvidia GTX 1050 TI is a computational powerhouse in a tiny package.  It dominates in terms of raw F@H PPD as well as PPD/Watt efficiency.  It is also worth mentioning that the total system power draw of only 140 watts is very impressive.

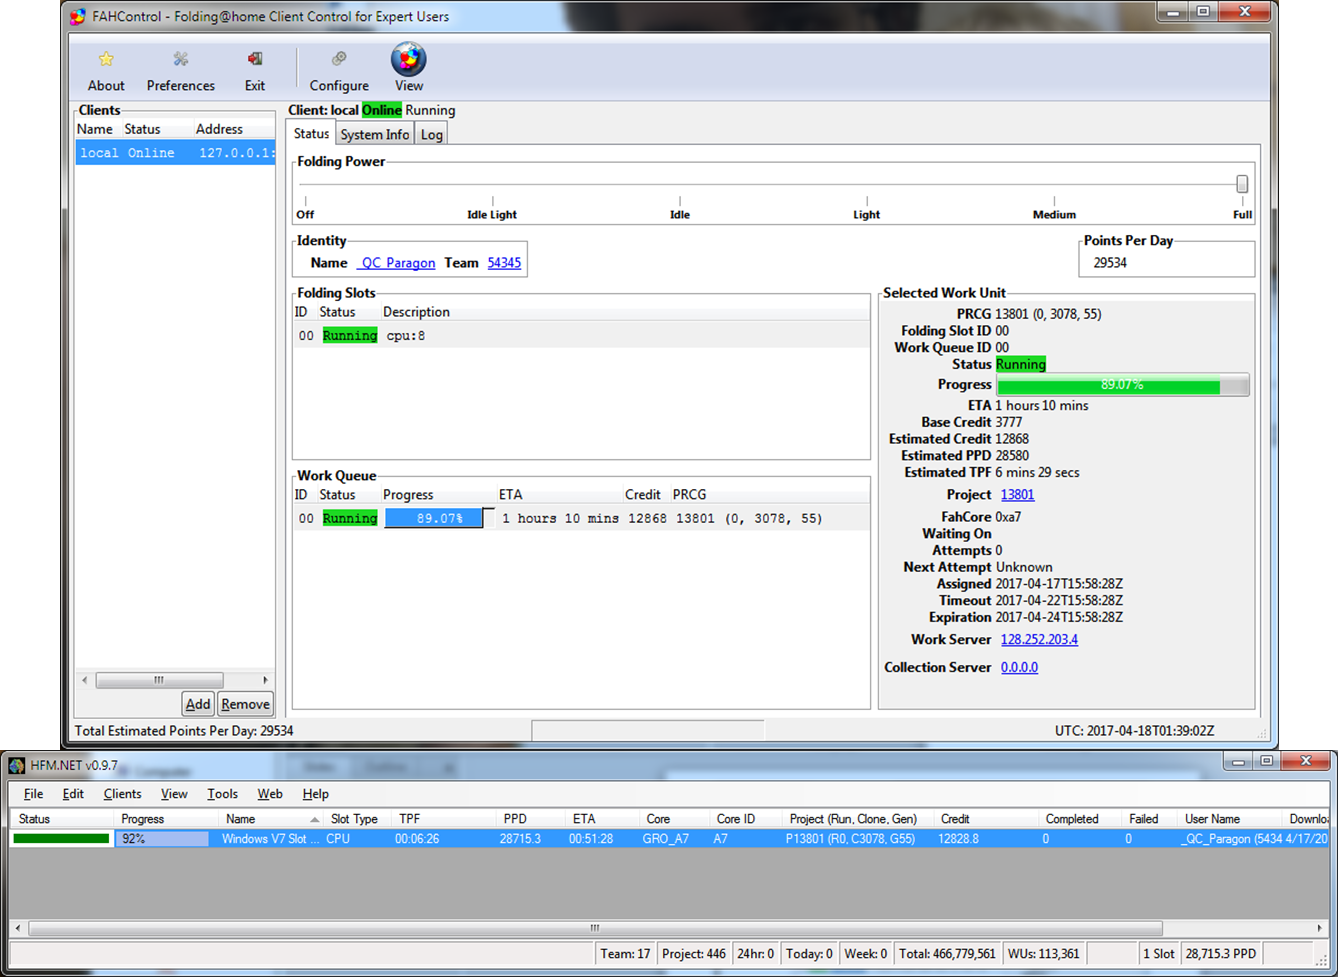
Screen Shot from F@H V7 Client showing Estimated Points per Day:

Nvidia GTX 1050 TI Folding@Home Performance

192K PPD Reported for 1050 TI!

Points Per Day (PPD) Performance and PPD/Watt Efficiency:

Nvidia GTX 1050 TI Folding@Home PPD Chart

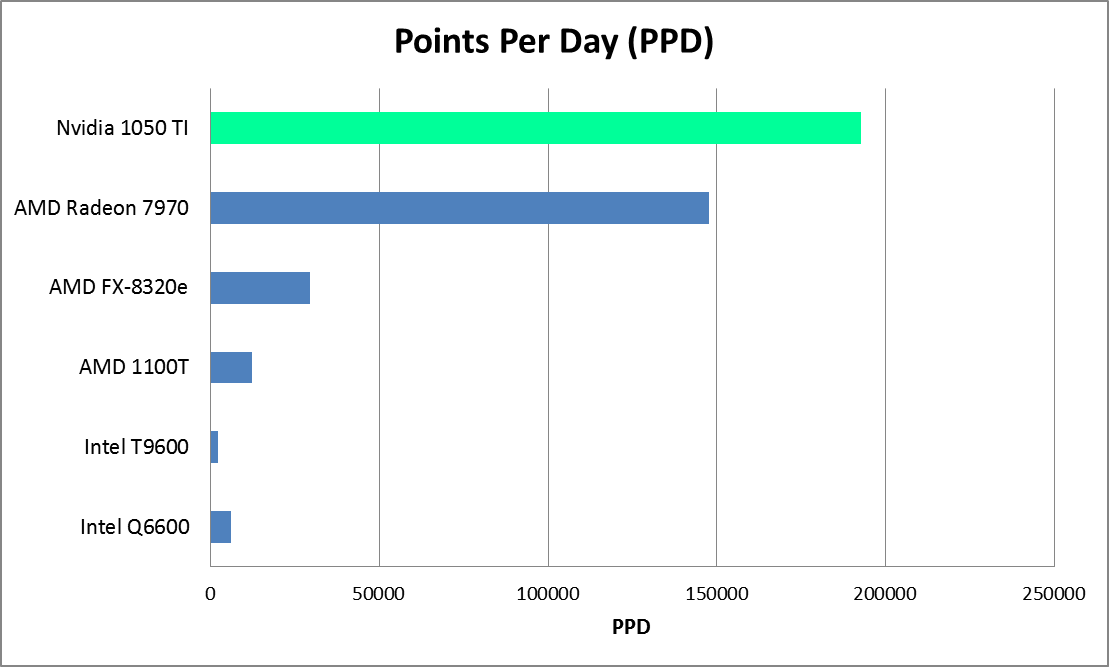
The Nvidia GTX 1050 TI produces about 190K Points Per Day and is faster than all hardware tested so far, including the AMD Radeon 7970

Nvidia GTX 1050 TI Folding@Home Efficiency Chart

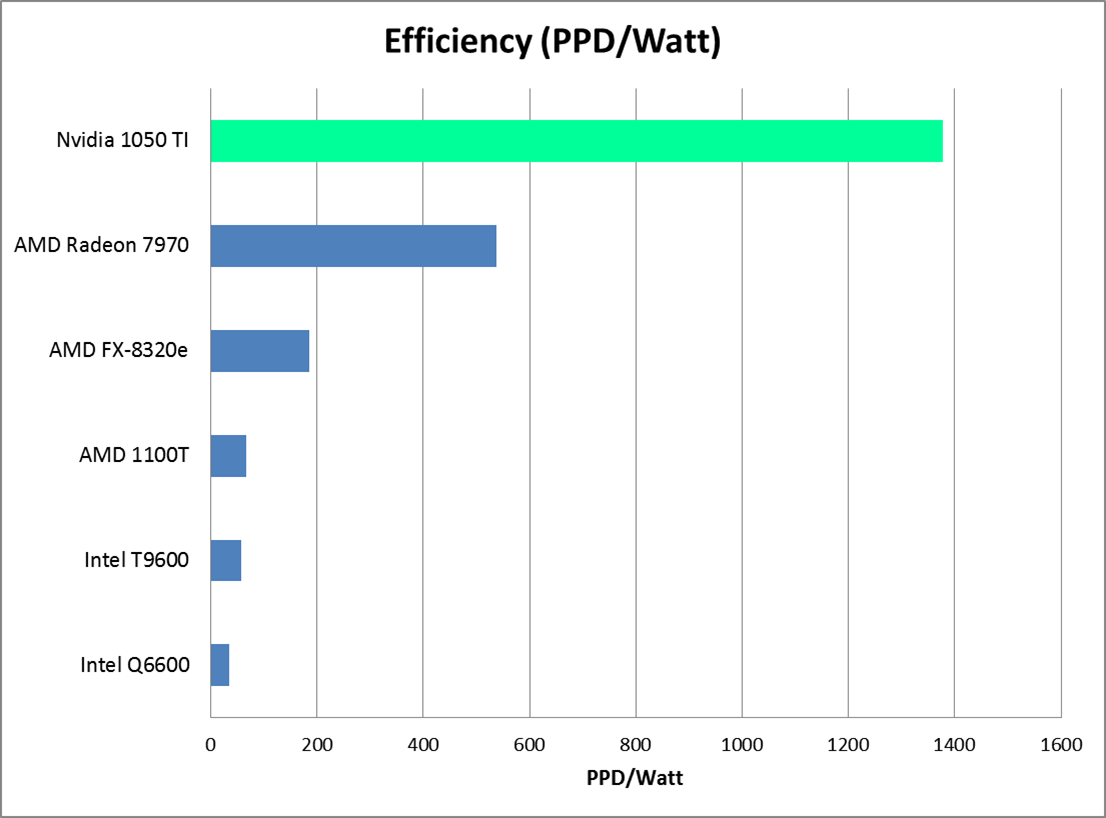
The Nvidia Geforce GTX 1050 TI is a very efficient graphics card, resulting in the highest PPD/Watt of all hardware tested so far.
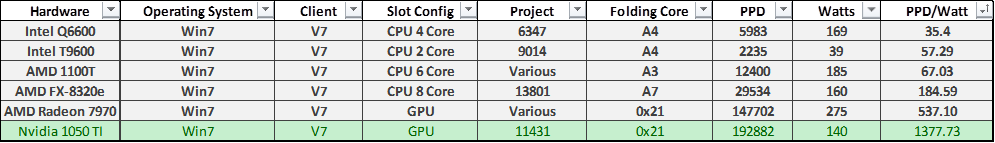
Detailed Table:

Nvidia GTX 1050 TI Folding@Home Stats Table

Real-World Performance Note

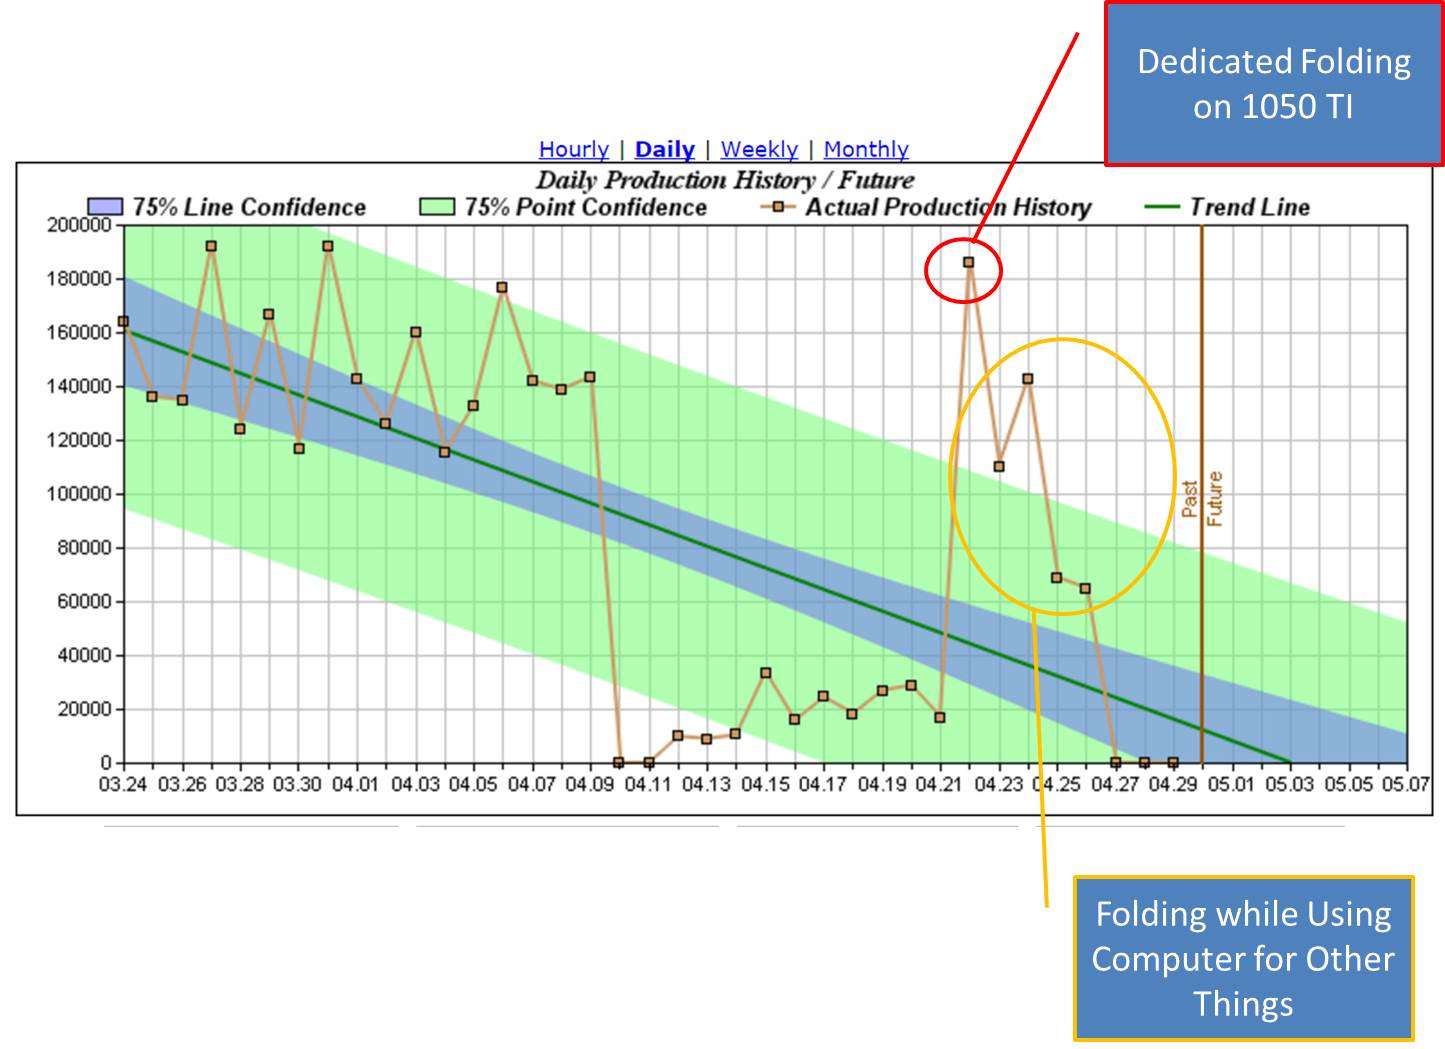
One thing I noticed when running on the GTX 1050 was the sensitivity to running other graphics operations and / or CPU folding.  After posting four work-units with an average PPD of over 185K PPD, my wife and I started using the computer for other tasks while leaving folding running.  We noticed significant lag with anything graphical, from scrolling through web pages to streaming video.  In addition, re-enabling 8-core CPU folding seemed to hurt PPD more than it helped (no formal testing numbers to document this at this time, sorry!).

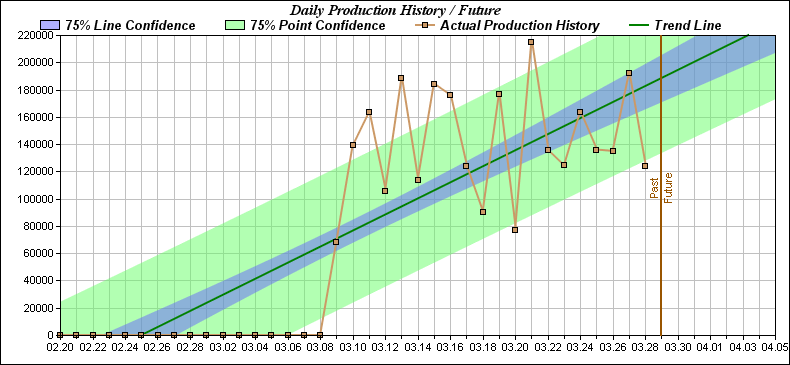
The performance hit of not having a dedicated F@H computer is evident in the following PPD chart, where the high data point is the result of dedicated folding on the graphics card for a day, and the subsequent data points are the result of trying to do other things on the computer as well.  Eventually, we decided to pause F@H to get any respectable streaming quality out of our evening shows.  This wasn’t noticed when folding on the AMD Radeon 7970.  It probably is a consequence of every last bit of the GTX 1050’s compute horsepower being prioritized for F@H, which is one of the reasons why this card does so well when left to fold to its heart’s content.  It looks like an article on building a low-cost dedicated folding box is in order!

Nvidia GTX 1050 TI Folding@Home Extended Testing PPD

Dedicated F@H Performance vs. Multi-Tasking

Conclusion

The Nvidia Geforce GTX 1050 TI excels at Folding@home.  Thanks to its low power consumption (75 watts) and advanced architecture, this card can produce up to 190K PPD in a desktop consuming a mere 140 watts of power from the wall.  This results in a F@H efficiency of nearly 1400 PPD/watt, which is twice that of the AMD Radeon 7970 that was the previous workhorse in my desktop.  Undoubtedly the higher-end GTX 10XX series graphics cards such as the 1070 offer even more performance, albeit at higher power consumption and much higher entry price than the $130 for the GTX 1050. For this price, you can’t go wrong if your goal is to do the most science for the least amount of power consumed while sticking to a tight budget.

Squeezing a few more PPD out of the FX-8320E

In the last post, the 8-core AMD FX-8320E was compared against the AMD Radeon 7970 in terms of both raw Folding@home computational performance and efficiency.  It lost, although it is the best processor I’ve tested so far.  It also turns out it is a very stable processor for overclocking.

Typical CPU overclocking focuses on raw performance only, and involves upping the clock frequency of the chip as well as the supplied voltage.  When tuning for efficiency, doing more work for the same (or less) power is what is desired.  In that frame of mind, I increased the clock rate of my FX-8320e without adjusting the voltage to try and find an improved efficiency point.

Overclocking Results

My FX-8320E proved to be very stable at stock voltage at frequencies up to 3.6 GHz.  By very stable, I mean running Folding@home at max load on all CPUs for over 24 hours with no crashes, while also using the computer for daily tasks.   This is a 400 MHz increase over the stock clock rate of 3.2 GHz.  As expected, F@H production went up a noticeable amount (over 3000 PPD).  Power consumption also increased slightly.  It turns out the efficiency was also slightly higher (190 PPD/watt vs. 185 PPD/watt).  So, overclocking was a success on all fronts.

FX 8320e overclock PPD

FX 8320e overclock efficiency

Folding Stats Table FX-8320e OC

Conclusion

As demonstrated with the AMD FX-8320e, mild overclocking can be a good way to earn more Points Per Day at a similar or greater efficiency than the stock clock rate.  Small tweaks like this to Folding@home systems, if applied everywhere, could result in more disease research being done more efficiently.

CPU Folding Revisited: AMD FX-8320E 8-Core CPU

In the last article, I made the statement that running Stanford’s Folding@home distributed computing project on CPUs is a planet-killing waste of electricity.  Well, perhaps I didn’t say it in such harsh terms, but that was basically the point.  Graphics cards, which are massively multi-threaded by design, offer much more computational power for molecular dynamics solutions than traditional desktop processors.  More importantly, they do more science per watt of electricity consumed.

If you’ve been following along, you’ve probably noticed that the processors I’ve been playing around with are relatively elderly (if you are still using a Core2 anything, you might consider upgrading).  In this article, I’m going to take a look at a much newer processor, AMD’s Vishera-based 8-core FX-8320e.  This processor, circa 2015, is the newest piece of hardware I currently have (although as promised in the previous article, I’ve got a brand new graphics card on the way).  The 8-core FX-8320e is a bit of a departure for AMD in terms of power consumption.  While many of their high end processors are creeping north of 125 watts in TDP, this model sips a relatively modest (for an 8-core) 95 watts of power.  As shown previously here, with more cores, F@H efficiency increases along with overall performance.  The 8320e chip should be no exception.

Processor Specs:

  • Designation: AMD FX-8320e
  • Architecture: Vishera
  • Socket: AM3+
  • Manufacturing Process: 32 nm
  • # Cores: 8
  • Clock Speed: 3.2 GHz (4.0 Turbo)
  • TDP: 95 Watts

Side Note: As many will undoubtedly mention, this processor isn’t really a true 8-core in the sense that each pair of cores shares one Floating Point Unit, whereas an ideal 8-core CPU would have 1 FPU per core.  So, it will be interesting to see how this processor does against a true 1 to 1 processor such as the 1100T (six FPUs, reviewed here).

All of my power readings are at the plug, so the host system plays a part in the overall efficiency numbers reported.  Here is the configuration of my current test computer, for reference:

Test Setup Specs:

  • CPU: AMD FX-8320e
  • Mainboard : Gigabyte GA-880GMA-USB3
  • GPU: Sapphire Radeon 7970 HD
  • Ram: 16 GB DDR3L (low voltage)
  • Power Supply: Seasonic X-650 80+ Gold
  • Drives: 1x SSD, 2 x 7200 RPM HDDs, Blu-Ray Burner
  • Fans: 1x CPU, 2 x 120 mm intake, 1 x 120 mm exhaust, 1 x 80 mm exhaust
  • OS: Win7 64 bit

Folding Results

Since I’ve been out of CPU folding for a while, I had to run through 10 CPU work units in order to be eligible to start getting Stanford’s quick return bonus (extra points received for doing very fast science).  You can see the three regions on the plot.  The first region is GPU-only folding on the 7970.  The second region is CPU-only folding on the FX-8320e prior to the bonus points being awarded.  The third region is CPU-only folding with QRB bonus points.  Credit for the graph goes to http://folding.extremeoverclocking.com/.

Radeon 7970 GPU vs AMD FX 8320e CPU Folding@home Performane

An 8-core processor is no match for a graphics card with 2048 Shaders!

The 8-core AMD chip averages about 20K PPD when doing science on the older A4 core. Stanford’s latest A7 core, which supports Advanced Vector Extensions, returns about 30K PPD on the processor.  In either case, this is well short of the 150K PPD on the graphics card, which is also about three years older than the CPU!  Clearly, if your goal is doing the most science, the high-end graphics card trumps the processor.  (Update note: Intel’s latest processors such as the 6900X have been shown to return in excess of 120K PPD on the A7 core.  This makes CPUs relevant again for folding, but not as relevant as modern high-end graphics cards, which can return up to a million PPD!  I’ll have more articles on these later, I think…)

Efficiency Numbers

I used both HFM.net and the local V7 client to obtain an estimated PPD for the A7 core work unit, which should represent about the highest PPD achievable on the FX-8320e in stock trim.

FX 8320e PPD Performance

According to the watt meter, my system is drawing about 160 watts from the wall.  So, 29534 PPD / 160 watts is 185 PPD/Watt.  Here’s how this stacks up with the hardware tested so far.

Folding@Home Performance Table with AMD 8320e

Conclusion

Even though the Radeon HD 7970 was released 3 years earlier than AMD’s flagship line of 8-core processors, it still trounces the CPU in terms of Folding@home performance. Efficiency plots show the same story.  If you are interested in turning electricity into disease research, you’d be better off using a high-end graphics card than a high-end processor.  I hope to be able to illustrate this with higher end, modern hardware in the future.

As a side note, the FX-8320e is the most efficient folder of the processors tested so far. Although not half as fast as the latest Intel offerings, it has performed well for me as a general multi-tasking processor.  Now, if only I could get my hands on a new CPU, such as a Kaby Lake or a Ryzen (any one want to donate one to the cause?)…

Folding on Graphics Cards

After focusing on CPUs only, it’s time to turn up the performance and discuss graphics card folding.  Today’s graphics cards are massively parallel, and lend themselves to molecular dynamics problems more so than general CPUs.  Folding@home has benefited from developing projects to run on graphics cards.  Gamers, naturally competitive creatures by nature, have taken the F@H stats by storm.  Except for a few incredibly complex multi-CPU systems, high-end folding rigs are almost entirely GPU based at this point in time.

GPUs offer increased performance and efficiency compared to CPUs.  In order to offer a fair comparison to the CPU hardware tested on this blog (all very old by 2017 standards), I loaded up F@H on my 5-year-old Sapphire RADEON HD 7970 to see how it compares to the elderly hardware I’ve tested so far.  The results speak for themselves (production plot courtesy of http://folding.extremeoverclocking.com/)

7970 Graph

GPU vs CPU Table

I ran F@H for multiple days in order to get some good averaging on the results.  As you can see from the production graph, some projects return more points than others, but at an average PPD of nearly 150K, the Radeon 7970 destroys the CPU-based competition. More importantly, it does so with much more efficiency than processors.

Performance Summary: GPU vs CPU

Performance 7970 Efficiency Summary: GPU vs CPU

Efficiency 7970

Conclusion

Even though more total power was consumed, running Folding@home on a high-end graphics card results in much more science for a given amount of power.  Next time, we’ll put a modern mid-range graphics card to the test to see how far things have come in the past 5 years…