Folding on the Gigabyte AERO 16 Part 1: Initial Setup and Test Plan
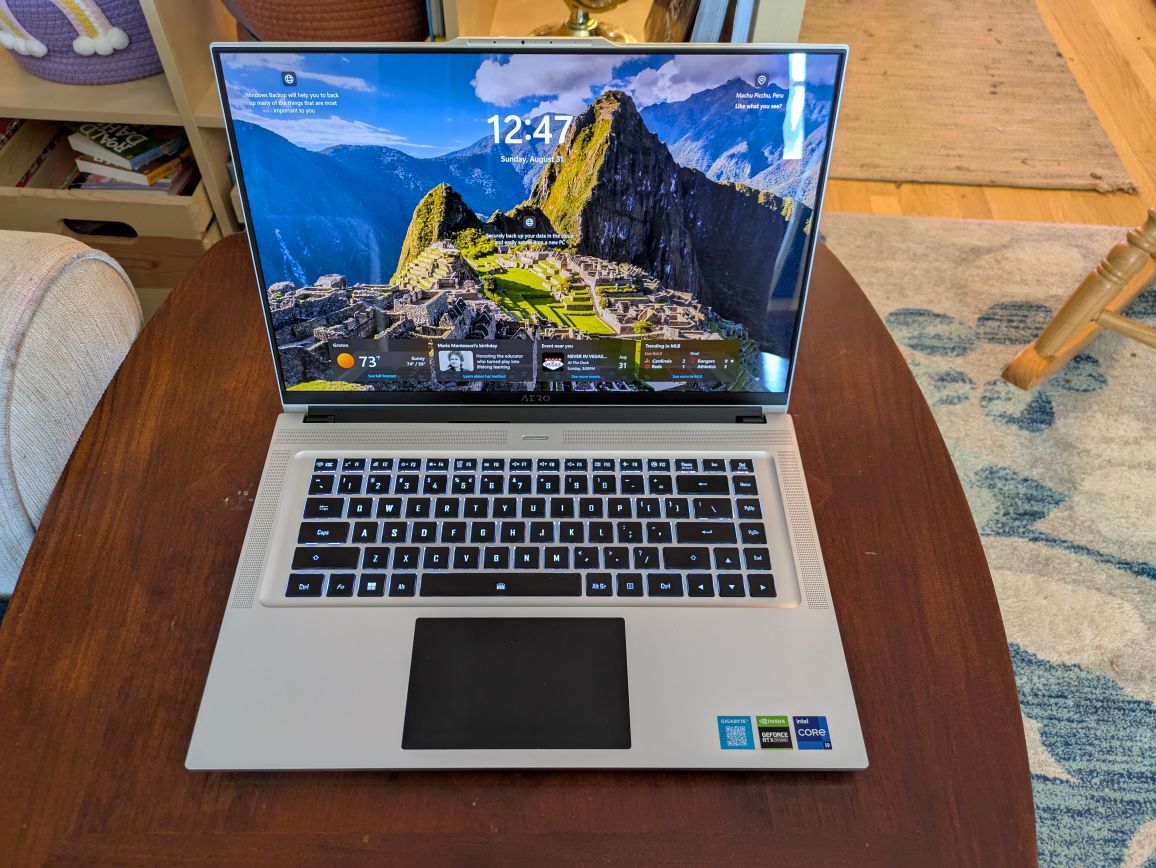
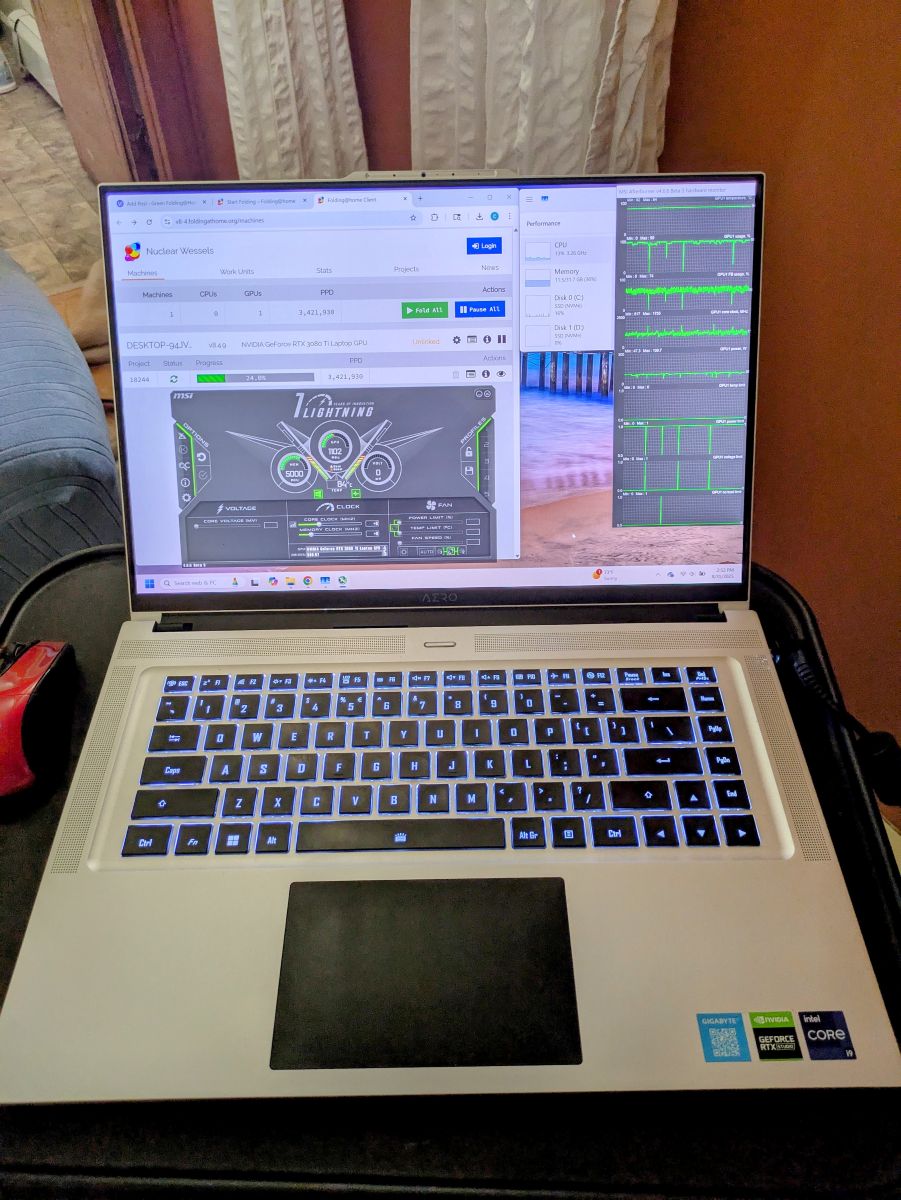
Hey everyone. I have an exciting update….I got a new (to me) computer! This time, it’s a “productivity laptop”, which is to say it’s a sleek, aluminum machine with a heavy-duty CPU and GPU inside. Here it is:
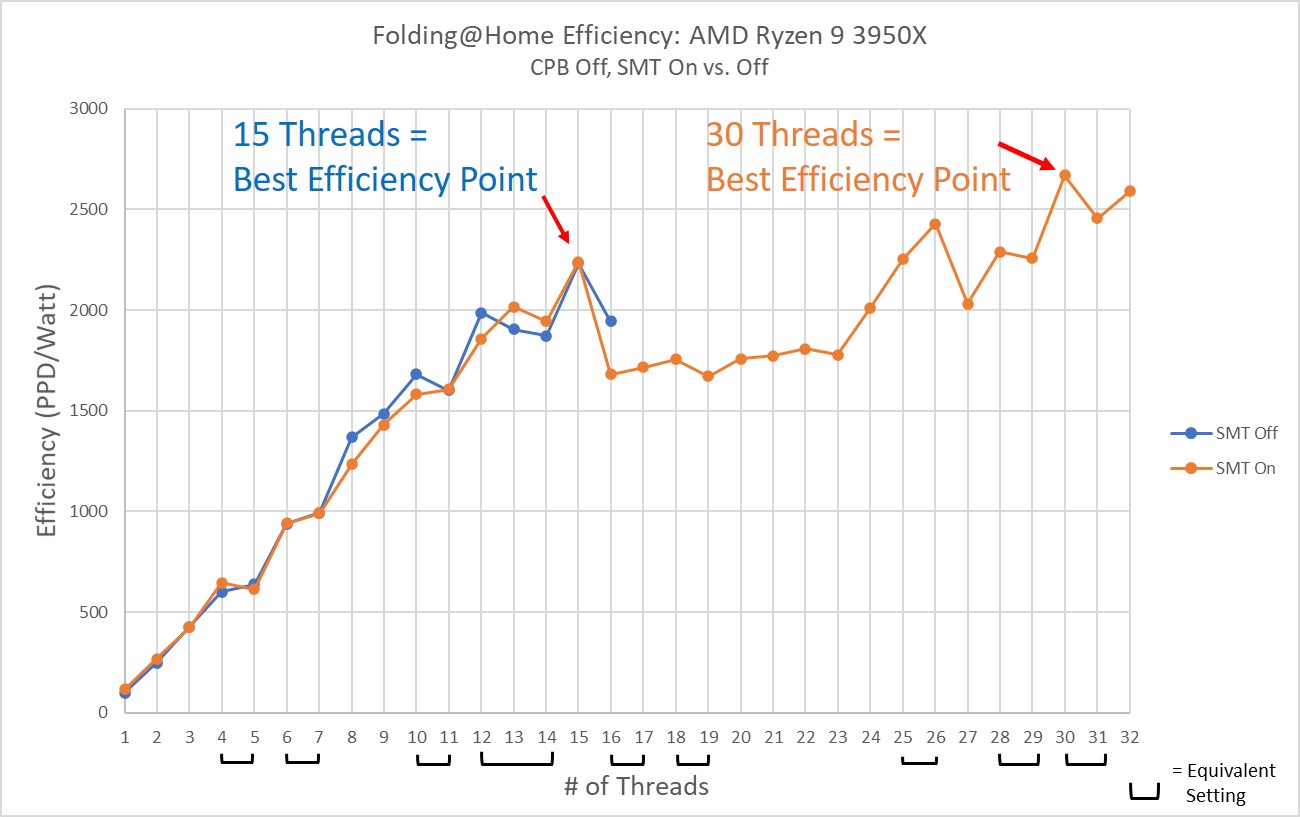
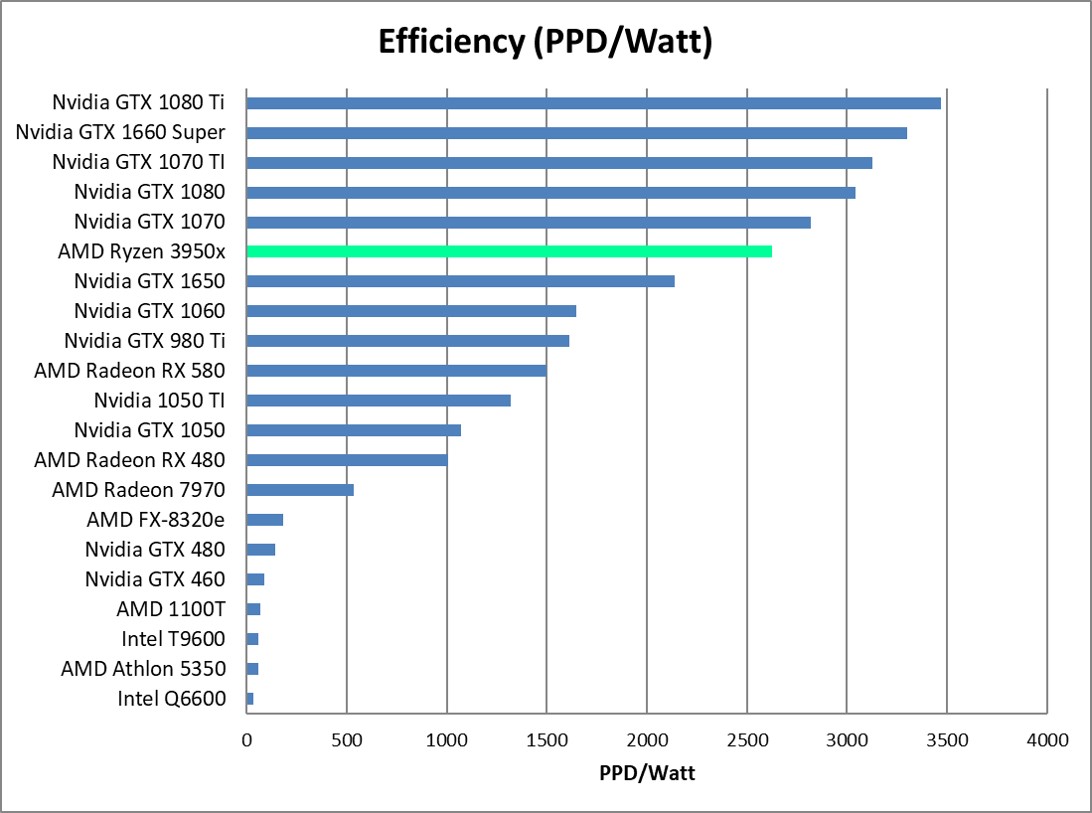
Mechanical Design Influences Efficiency
The purpose of this article series is to find out just how well laptops do for scientific compute workloads in Folding@Home, the distributed computing project aimed at disease research. Specifically, I’m testing out the hypothesis that laptop hardware and tuning is inherently more energy efficient. The laptop form factor demands that the hardware inside produce less heat than an ATX desktop form factor, because the laptop’s mass and available cooling airflow is significantly less than that of a desktop. By design, a laptop should be more efficient than a desktop. Without being optimized for efficiency, laptops would suffer from extreme heat, poor battery life, reduced battery health, and lack of sales (no one wants to buy a machine that burns your legs and doesn’t last).
This Gigabyte Aero 16 is from 2022, so it’s about two generations behind the bleeding edge, but still relevant. This was a high-end laptop when it was released, and it had the price tag to prove it (MSRP of $4800 as configured). For those of you who have been following along, you know that I tend to review and benchmark slightly older hardware, because it can be obtained at a much more reasonable used price ($1300 on eBay in this case). The performance tuning and optimizations are largely the same, so for the purposes of demonstrating Folding@Home on a laptop, I expect these results to be just as relevant as if I were using a brand new machine.
Here are the specs
Gigabyte Aero 16 YE5 (2022) Specs
CPU: Intel Core I9 12900H, 14 cores (6 Performance, 8 Efficient), 20 threads
Memory: 32 GB DDR5 4800 MHz
GPU0: NVidia RTX 3080 TI, 16GB
GPU1: Intel Integrated Iris Xe
Storate: 2 x 1 TB NVME SSD
Display: Samsung 4K OLED HDR 60Hz
What is a Productivity Laptop, Anyway?
Gigabyte markets the Aero series of laptops as prosumer “Productivity Laptops”, although the specifications would suggest these machines can game very well. I found that to be true (I’m playing Clair Obscur: Expedition 33 with max settings with almost no lag). The difference between productivity laptops such as the Aero and gaming laptops like the Asus Rog Strix is in the chassis design, the aesthetics, and the power profiles. Gaming laptops have that flashy RGB lighting, deeper chassis allowing for more cooling, higher power limits, and faster displays (60 Hz is considered pretty slow for a gaming monitor by today’s standards). The Gigabyte Aero 16 YE5, by comparison, is sleek, relatively thin (despite the big GPU), and sports a gorgeous but sluggish 4K display that content creators drool over thanks to its color accuracy.
One thing that caught my eye about the Aero 16 is the thrifty 105 watt built in GPU power limit for the beastly Nvidia RTX 3080 Ti. This is a monster of a mobile GPU, and most manufacturers who stick this in a laptop are targeting the top-tier gaming market. The typical TDP of the 3080 Ti (mobile) is between 115 and 150 watts, with some laptop manufacturers pushing it to 175 watts and more. This is a far cry from the desktop card’s 350 watt power dissipation, but it’s still a ton of power that must be dissipated as heat that would challenge most laptops.
In the case of Gigabyte, the 105 watt power limit (hardcoded in the vbios) means this laptop is not going to win the ultimate FPS contests with the likes of pure gaming machines. However, that isn’t the point. This machine was designed for content creators who want to be able to load high-poly models for beautiful rendering, or perhaps digital artists who’d like to cram Stable Diffusion 3.5 or Flux models entirely into the video card’s 16 GB of onboard memory.
If you’ve been following along on this blog, you know that for distributed computing projects such as Folding@Home, the maximum efficiency (most science done per watt of power) is typically achieved by down-clocking and/or undervolting the hardware to reduce the power consumption while preserving the majority of performance. Thus, it’s my hope that this specific laptop will set an energy efficiency record on this blog. If it does, it won’t be because of raw performance, but rather its carefully considered design for efficiency.
Nvidia 3080 Ti (mobile) GPU: Not quite the same thing as a 3080
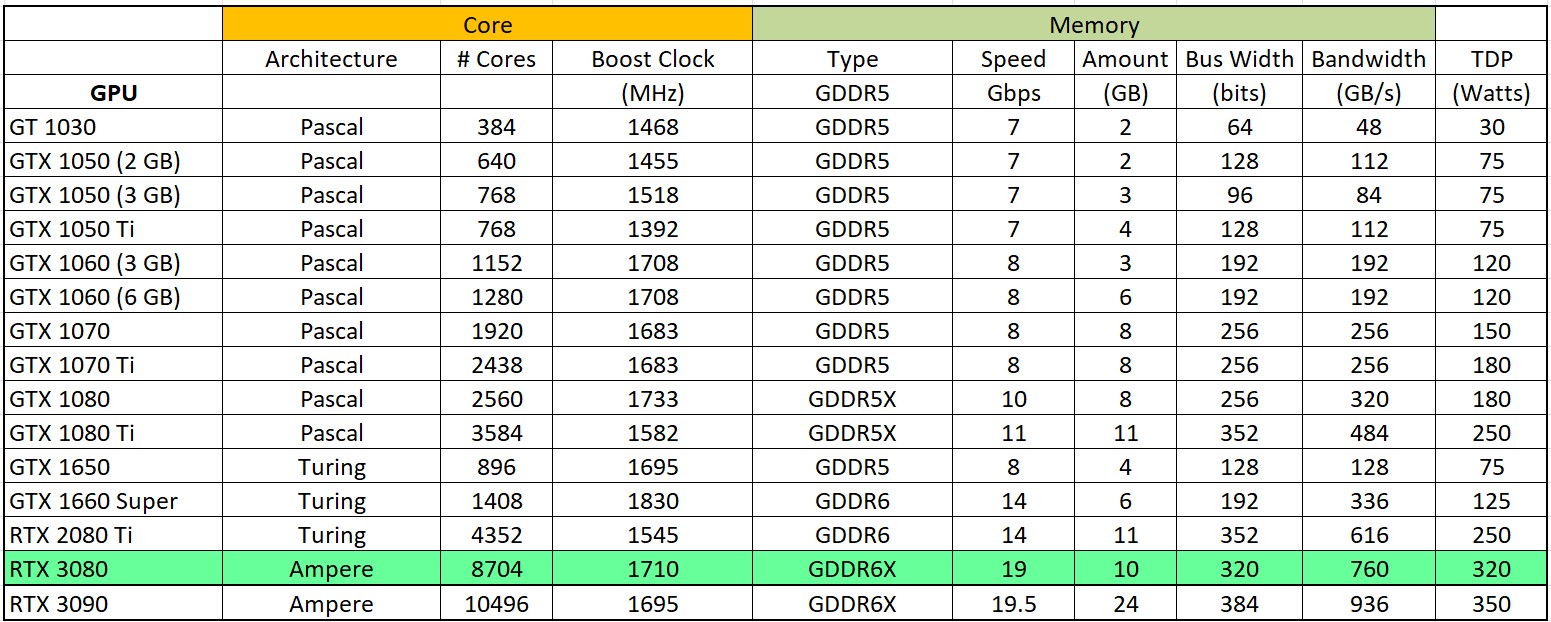
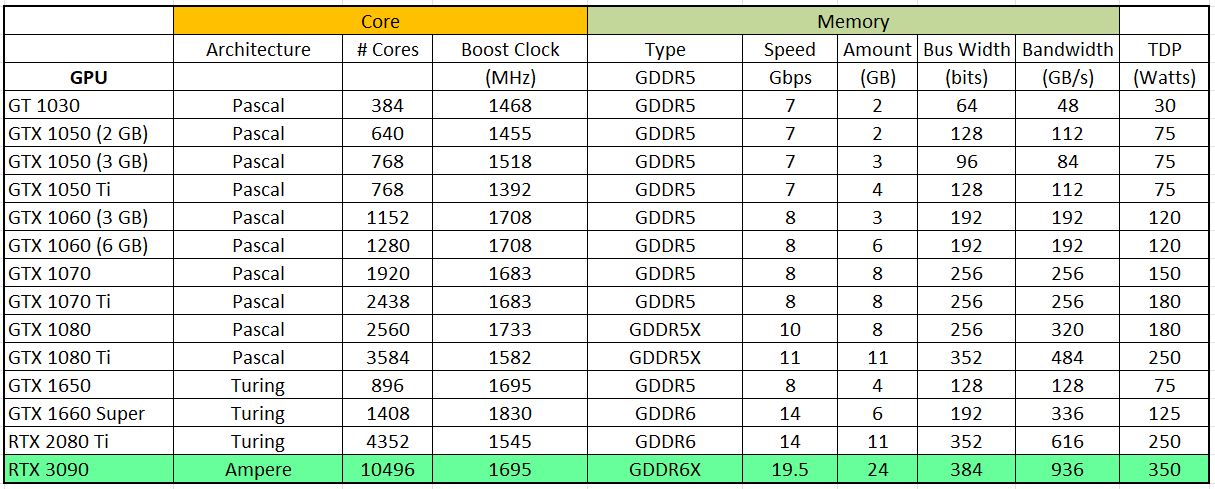
Before continuing, it’s important to note that Nvidia’s mobile implementation of the 3080 Ti is not at all the same thing as a desktop 3080 Ti. For detailed specs, you can read about the card here: https://www.techpowerup.com/gpu-specs/geforce-rtx-3080-ti-mobile.c3840
Notable differences between the laptop GPU and the desktop 3080 Ti are the number of CUDA cores (7424 vs 10240), the memory bus (256 GB vs 384 bit ), and the overall base / boost clock rates (810 / 1260 MHz vs 1365 / 1665 MHz). The desktop 3080 Ti is noticeably more powerful (and thirstier). Since I don’t have a full-sized 3080 Ti, the main point of comparison in this article will be against my 3080 (non-Ti), which has a more similar number of CUDA cores (8704) to the 3080 Ti mobile. See the table below for a detailed breakdown
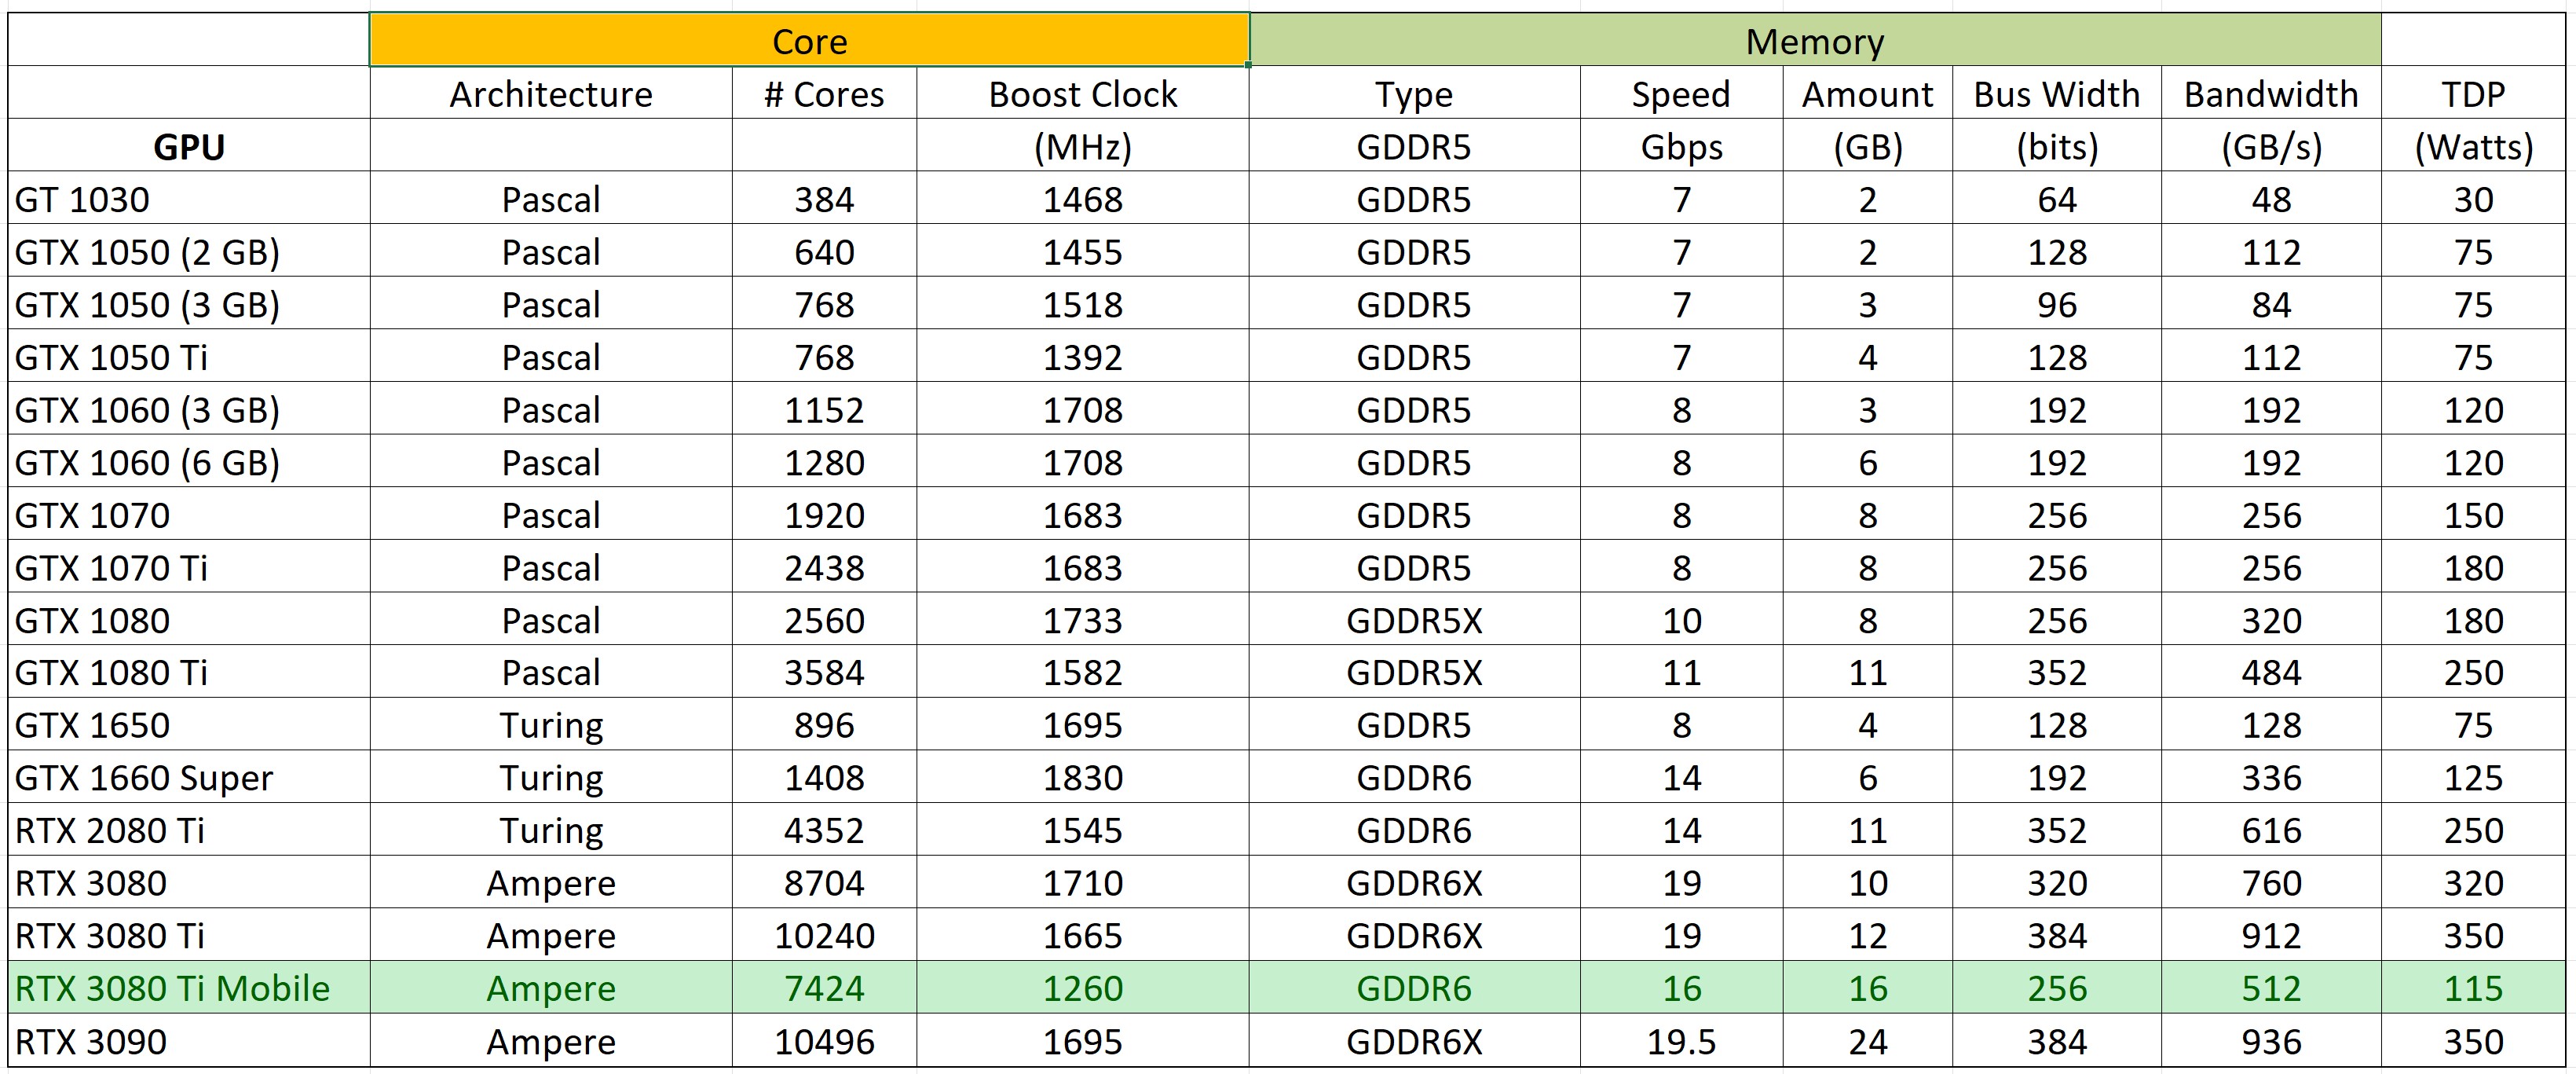
From eyeballing this chart, it’s possible to compute a rough PPD estimate of the 3080 Ti mobile compared to the desktop 3080 (which has a known PPD of about 7 million). To do this, we will derate the desktop 3080’s score by an approximate scaling ratio of GPU performance. This is possible to do since the 3080 and 3080 Ti mobile are both based on Nvidia’s Ampere architecture.
Scaling Ratio = [# CUDA Cores (3080 Ti Mobile) / # CUDA Cores (3080)] x [Boost Clock (3080 Ti Mobile)/Boost Clock (3080)]
Busting out the trusty calculator (BarelyCalc Credit: A. Colon):
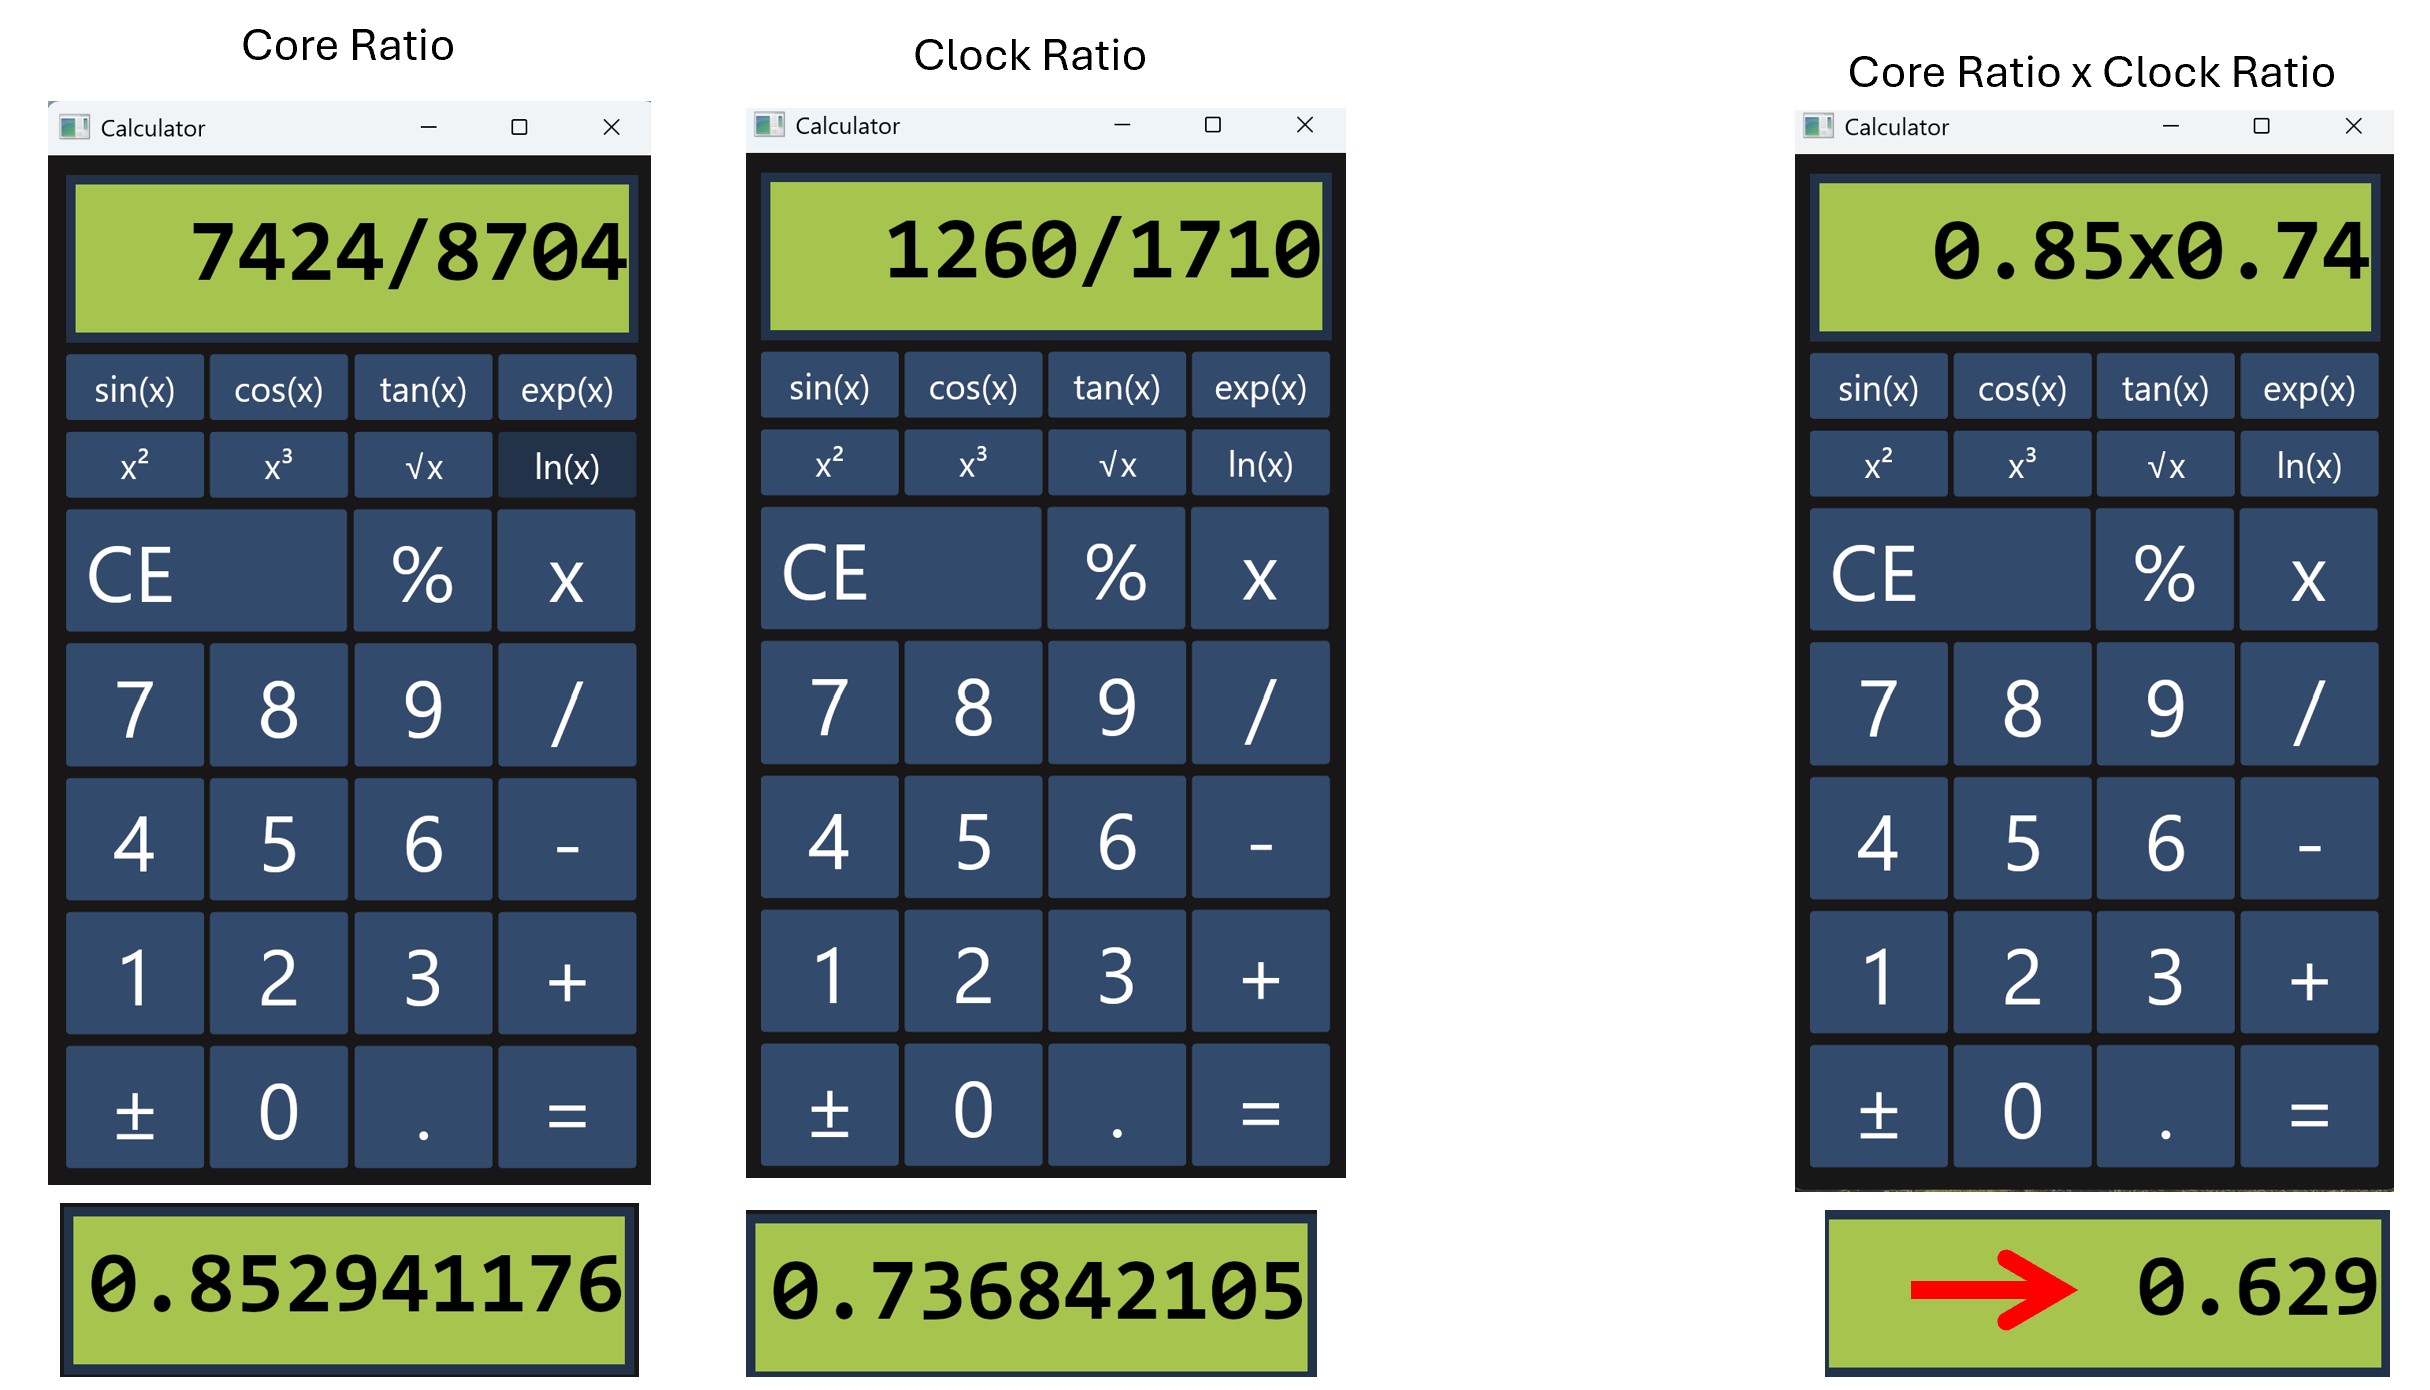
And scaling down the desktop 3080’s 7 million by 0.629 yields an estimated 3080 Ti mobile GPU performance of 4.4 million PPD.
Laptop Cooling–> Make sure you do it
For this test, I’m going to start with the laptop on a hard surface just to get a feel for the machine’s native cooling ability. The hard surface below the computer ensures the air intakes on the bottom have plenty of airflow. For short-term gaming and Folding@Home, this should provide adequate cooling. I expect the system to thermally throttle to keep itself cool. If anyone were to seriously consider using a laptop for long-term high-performance computing, a dedicated laptop cooler beneath the machine is highly recommended for the longevity of the device. For this test, I will be slipping my budget laptop cooler under the machine for the duration of benchmarking.
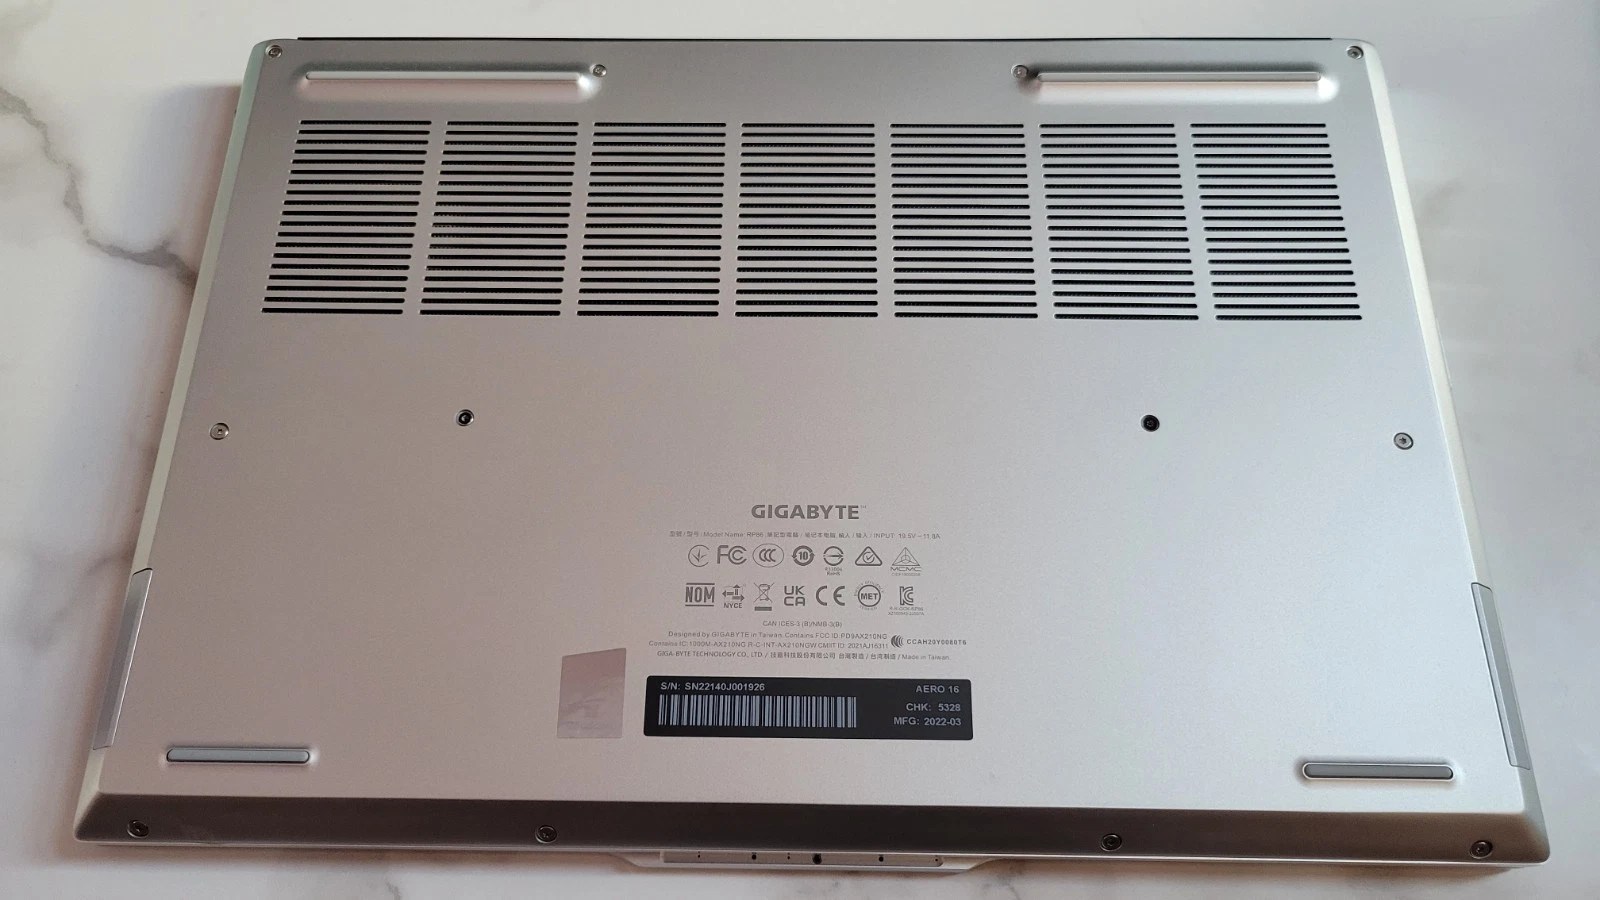
See the images below for the specific heatsink and cooling configuration on this Gigabyte. The bottom vents are generous (but not oversized as in some gaming laptops), and the twin fans provide cooling from both sides. This machine sucks in cool air from below and blows it out the sides and the back.
Here is what’s beneath the cover. Note the dual cooling fans and heat pipes:
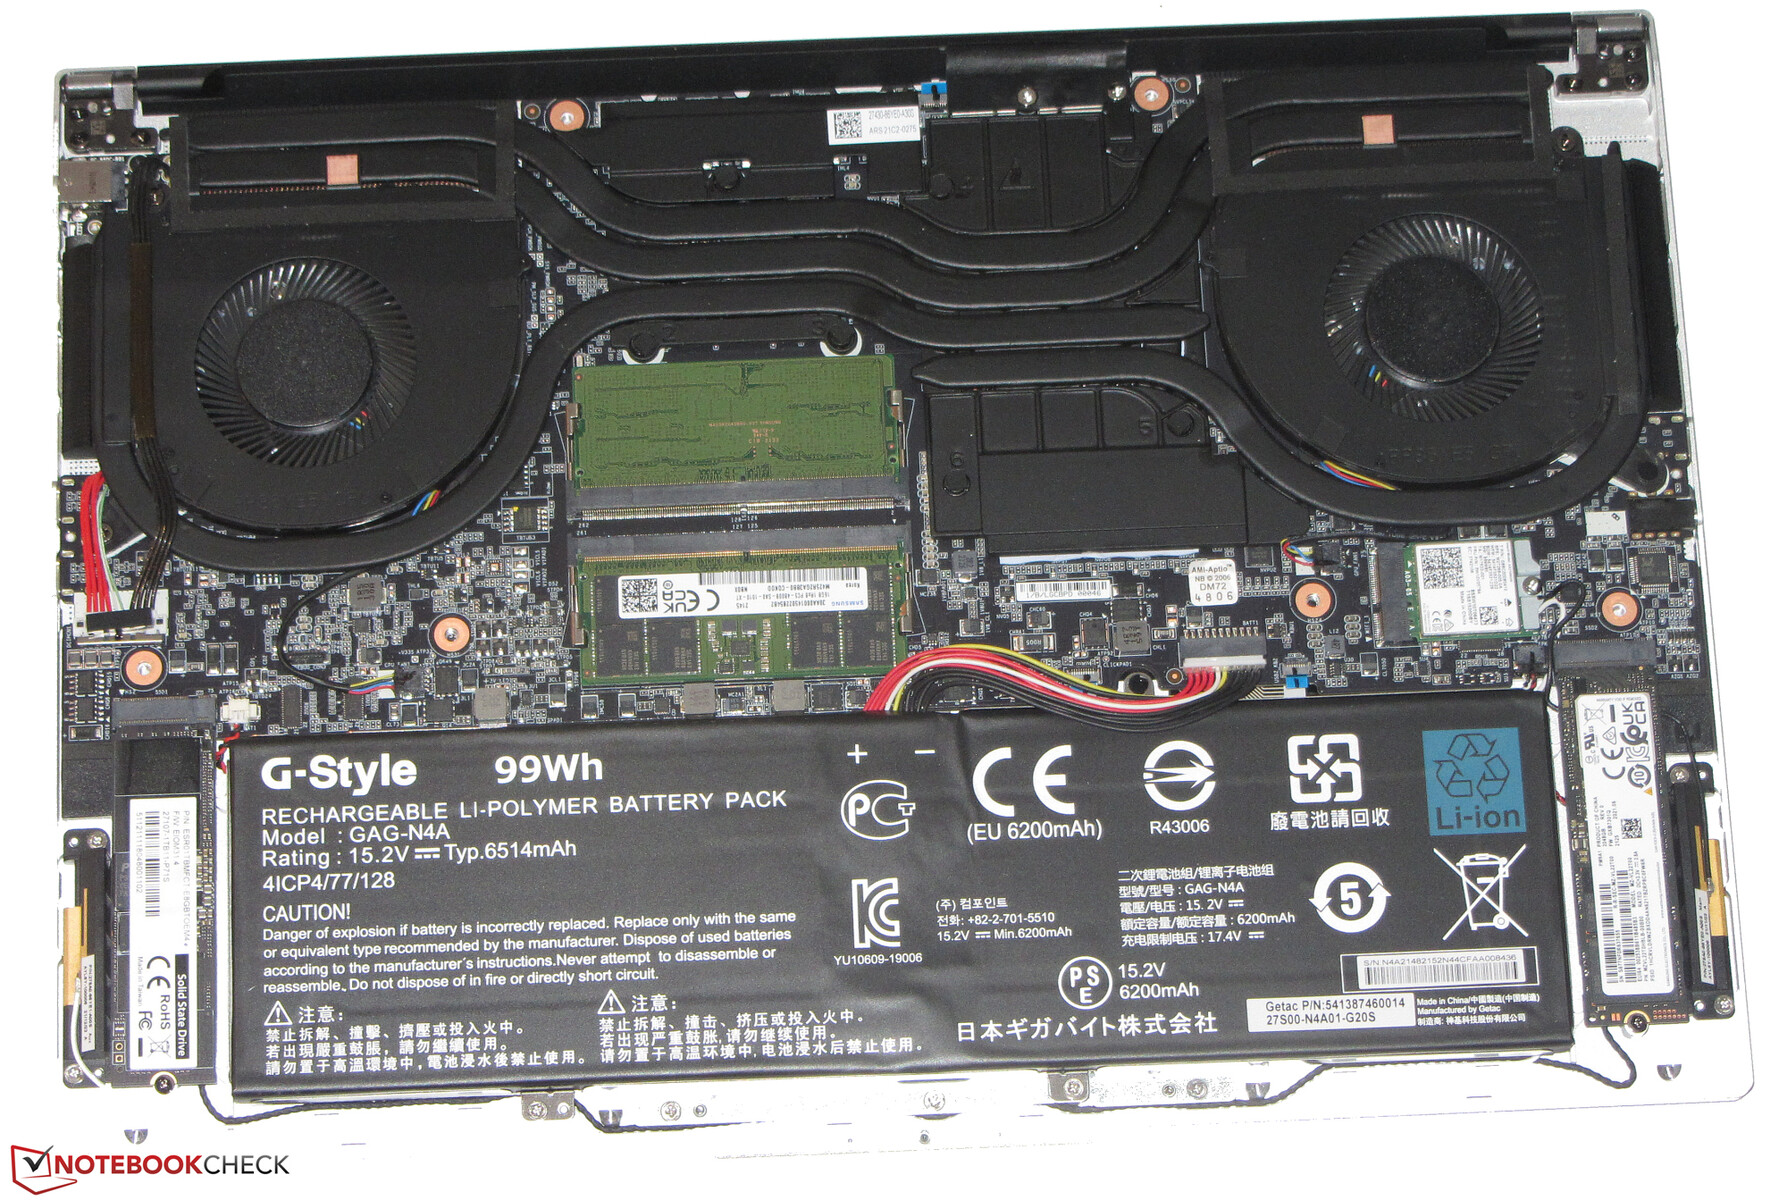
Credit for the inside shot goes to NoteBook Check! Please read their detailed review of the Aero 16, if interested, here: https://www.notebookcheck.net/Gigabyte-Aero-16-YE5-Review-Compact-4K-Multimedia-Notebook.610111.0.html
The Software Environment
I’ll be running this Folding@Home test in Windows 11 using the F@H client 8.4.9 on the GPU. This software is newer than what I’ve run in the past on my benchmark desktop, so the GPU performance plots won’t be an apples-to-apples comparison. But then again, it’s a bakeoff between a desktop and a laptop so…it’s more like a pineapples and grapes comparison.
The Metrics
As with all my previous articles, we’ll be using my trusty P3 Kill-A-Watt meter to measure power at the wall (laptop battery fully charged before testing so there should be no battery charging happening). Folding@Home performance is measured in Points Per Day (PPD). By measuring the system power consumption at the wall, we can compute the energy efficiency of this setup (PPD/Watt).
Pre-Test: Initial Configuration & Cooling
I downloaded the Folding@Home client here and configured one GPU slot for folding. Folding@Home, Google Chrome (for the client web app) and MSI Afterburner are going to be the only programs running during the test.
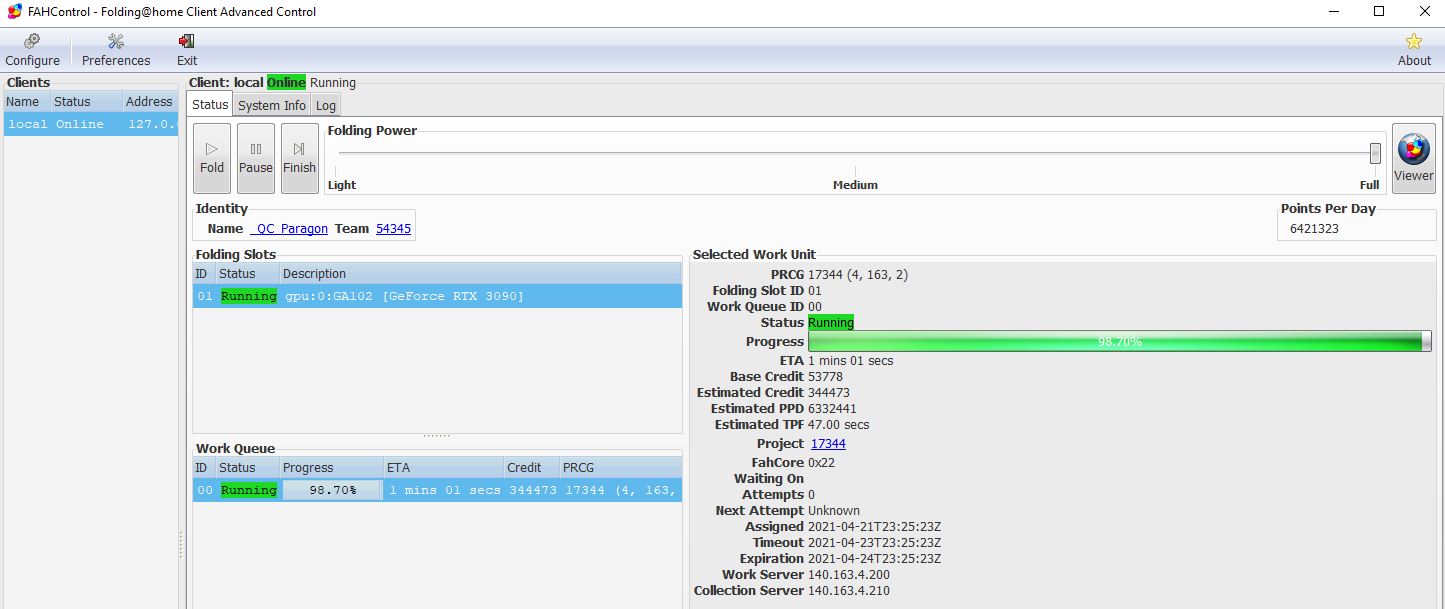
Below is the first work unit this machine has ever folded!
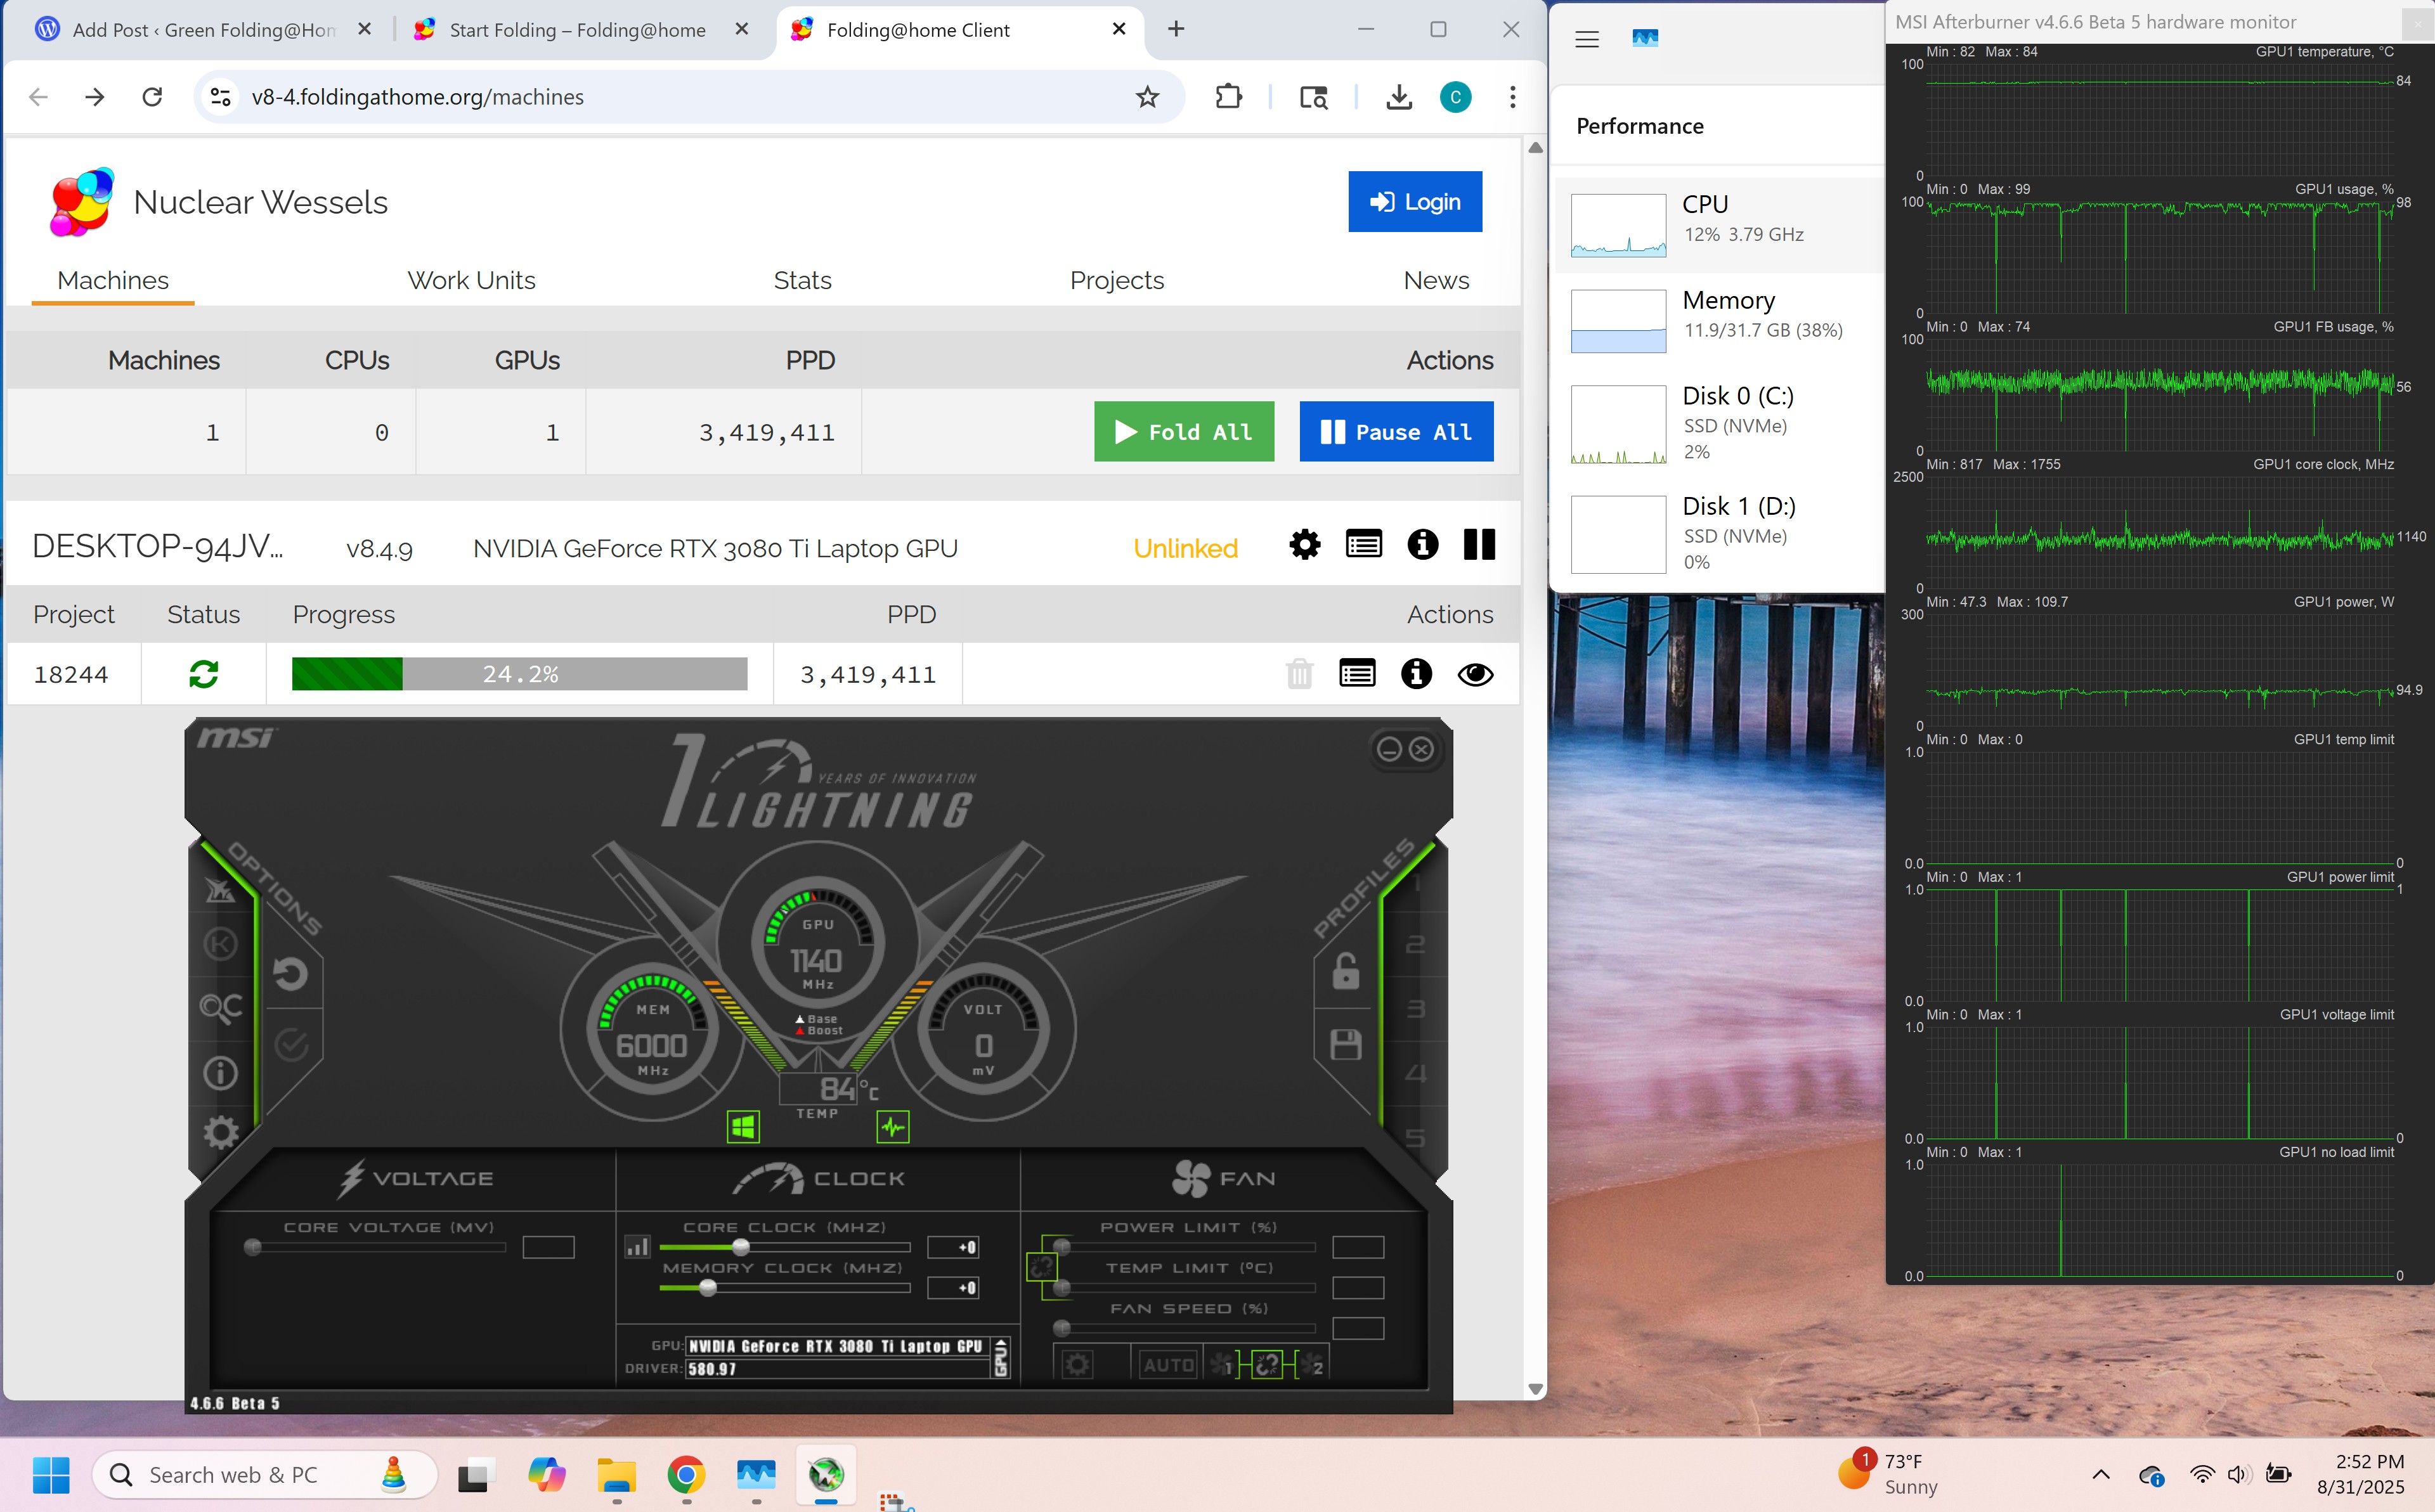
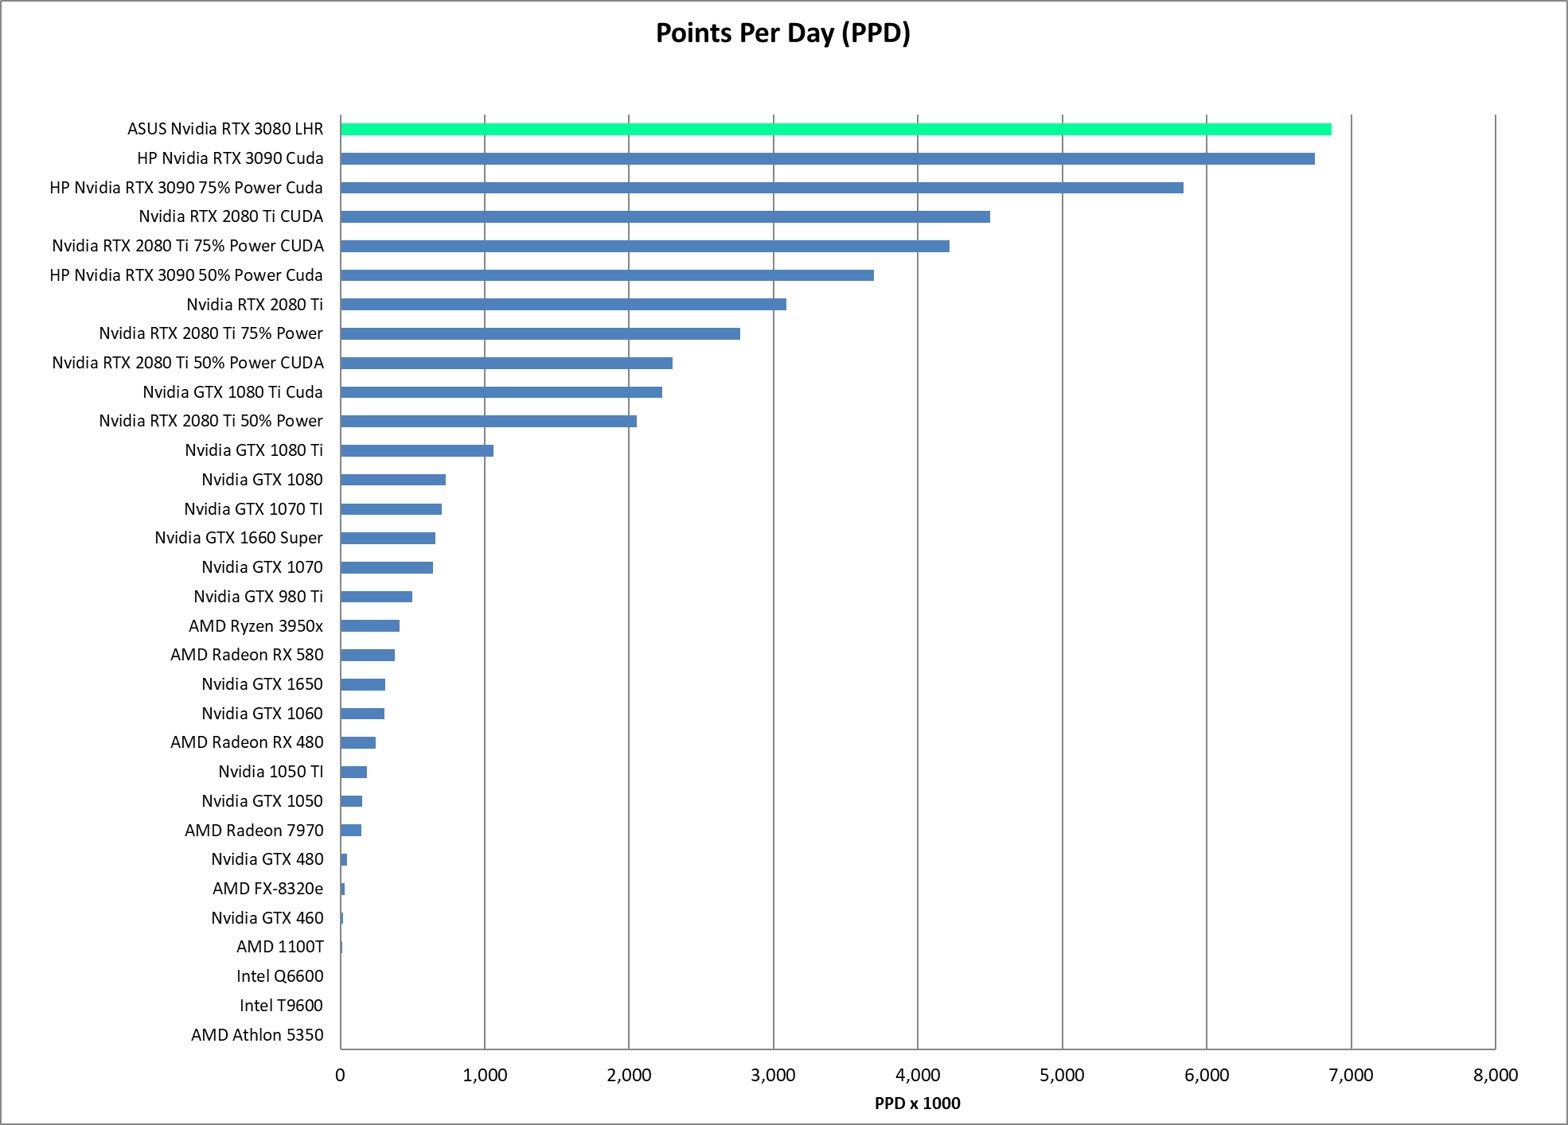
The initial work unit is estimating a 3.4 million PPD performance, which is a bit lower than the 4.4 million PPD I was estimating based on my experience with desktop 30xx-series GPUs. This could also be due to the fact that the Quick Return Bonus portion of the original Stanford University PPD score is exponential, not linear. It’s not worth worring over, as this is still an awesome score for a laptop. I didn’t have the watt meter hooked up (boo on me), but just roughing this out with a guess at total system power consumption of 100 watts results in an efficiency of 34K PPD/Watt! If that’s true, it’s a record for this blog! Part 2 of this article will thorougly investigate and optimize this performance.
There should be some room for signifigant optimization. I noticed the GPU core clocks are hovering right around 1100 MHz, so the machine isn’t hitting its full core boost clock rate. The GPU is pulling down about 95 watts, so slightly below the design’s advertised 105 watt TDP under the Windows default power profile. According to MSI Afterburner, the system is hitting the power limit, and is not actually thermally throttling (much to my surprise). The laptop is very hot to the touch, which means the aluminum case is doing its job dissipating the heat. The fans are kicked up to maximum, and I can tell this thing is begging for more cool air. GPU temps rose quickly and held steady at 84 degrees C. Let’s check out some thermals:
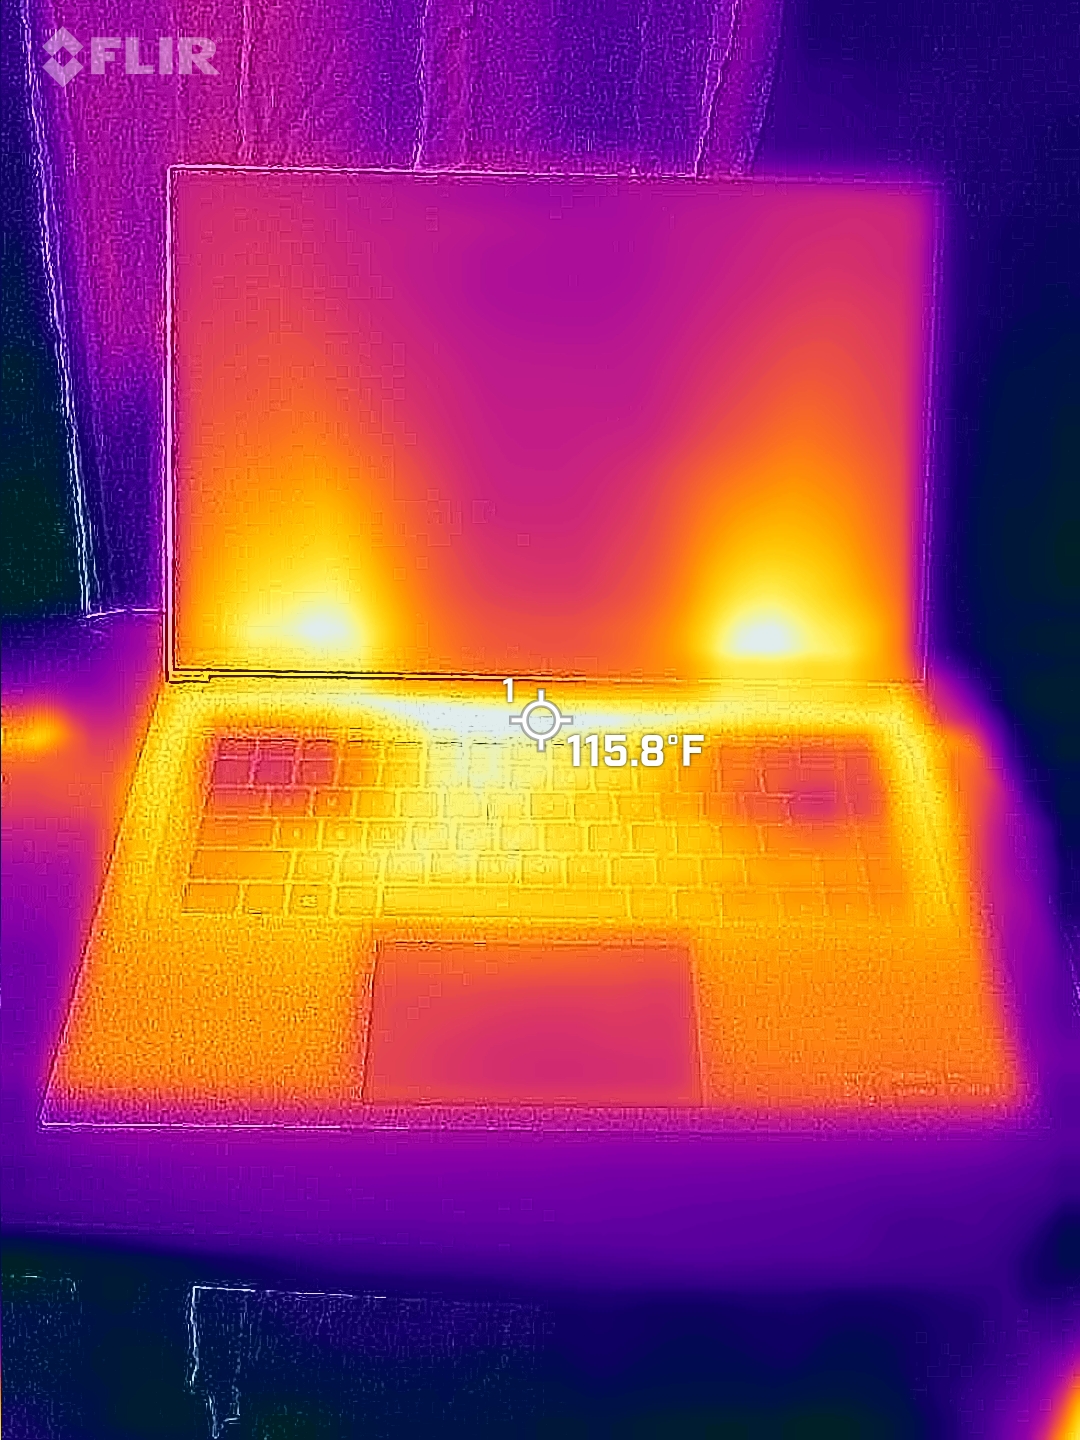
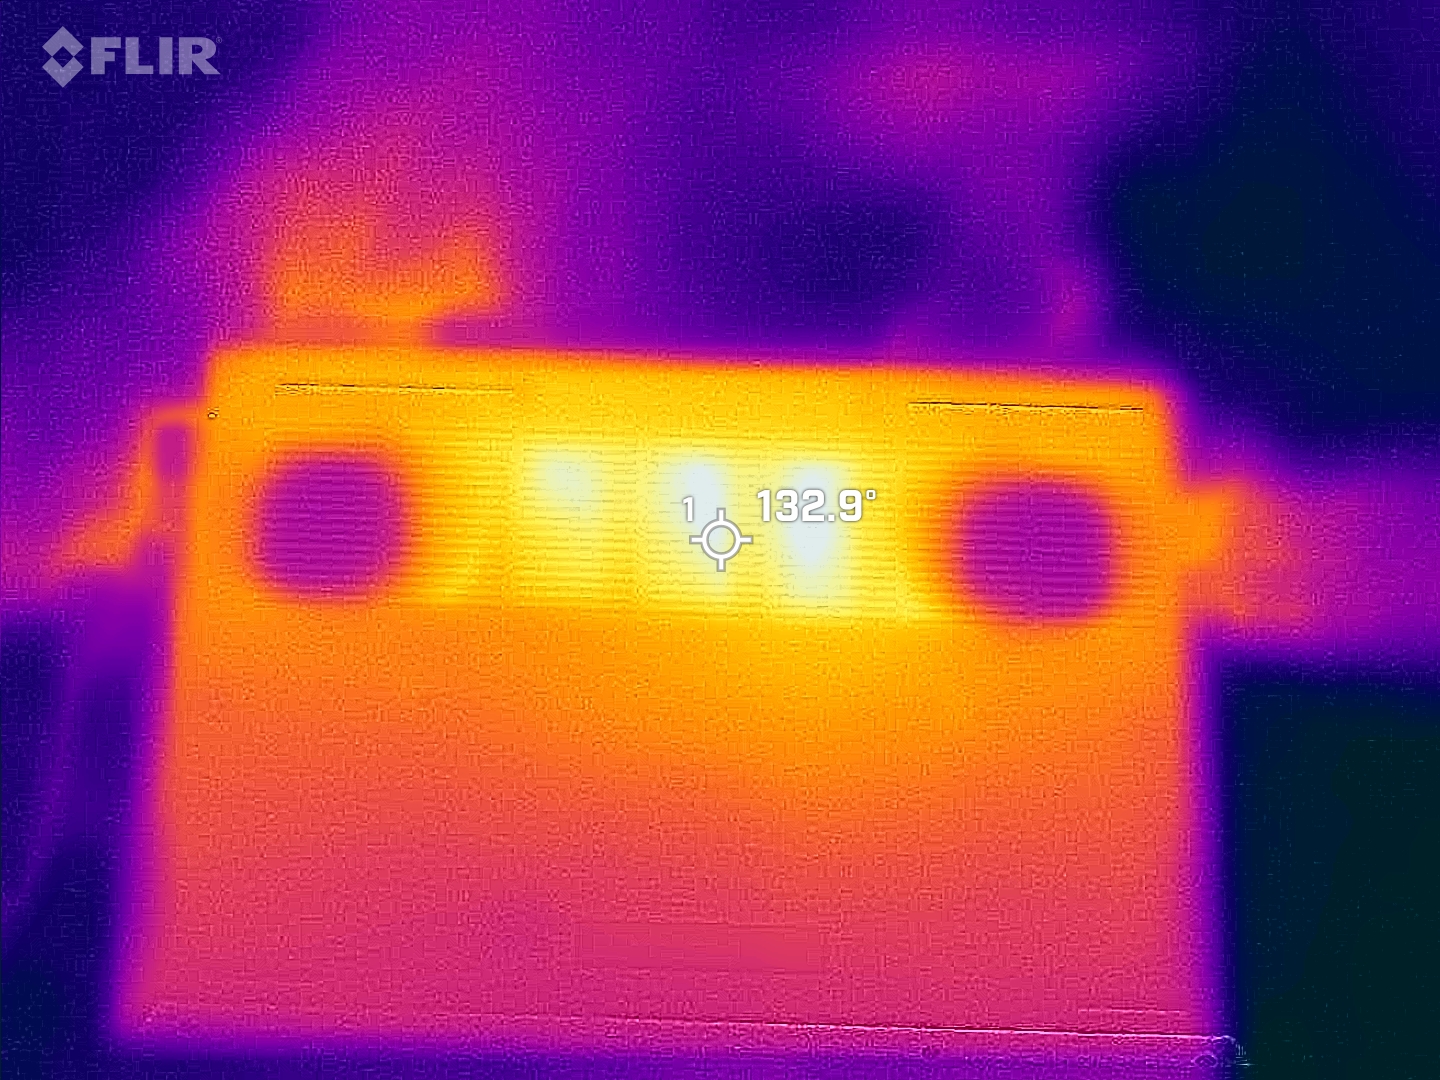
Note: My FLIR camera was set to report temps in Fahrenheit (sorry for mixing temperature units!). With a 115 degree F keyboard bezel and a 132 degree F bottom panel, this is one toasty laptop. In case anyone thinks this is a good thing, let me be clear: it’s too darn hot! High Performance Computing is a very not-normal use case for a laptop, and this result isn’t surprising. I’m not faulting Gigabyte at all. Based on these images and the fact that the laptop was too hot to hold, I’ll be breaking out the laptop cooler.
Laptop Cooler
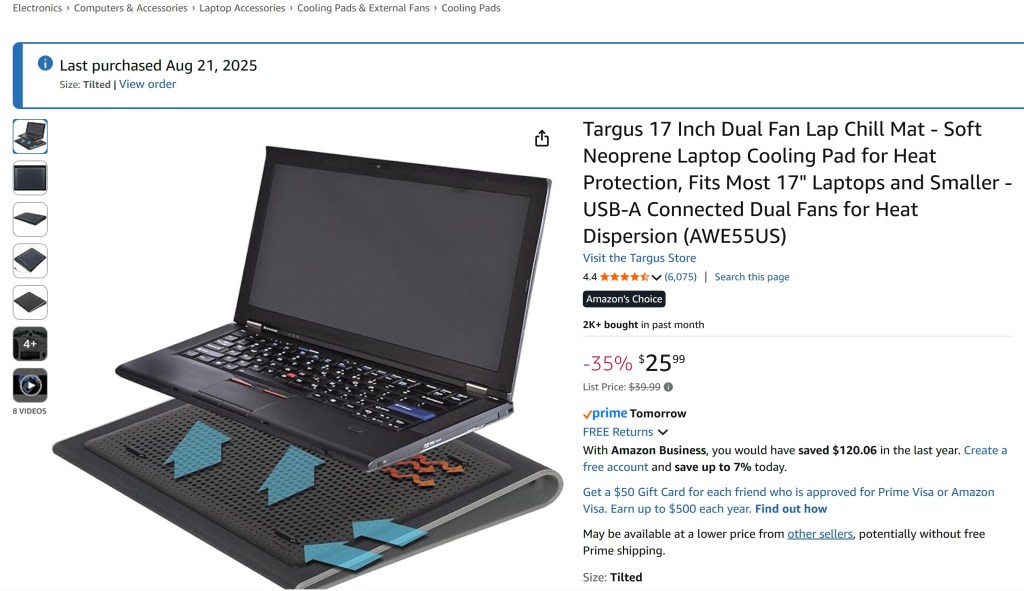
My laptop cooler is nothing special. For $25, this Targus model puts two small fans right under the air intakes on the bottom of the laptop. It’s a no-frills setup, but it has worked well for me for gaming by keeping the computer up off the bed sheets (the archnemesis of all laptop fan intakes). I was surprised with just how well this cooler did. After plugging it in (power coming from USB), the temperatures dropped from 84C to 71C, and the laptop’s fans became much quieter. The machine was still very warm to the touch though, and there wasn’t much of a change on the external radiating surface case temperatures. Still, based on that internal temp drop, I felt much more comfortable about doing some extended testing.
Side-Note: I did the cooling upgrade in the middle of the first work unit. You can see from the MSI afterburner plot that the overall FB Usage on the GPU (corresponding to memory load) became much less hashy after the temps came down, which may indicate more stable operation. Also, there was a very slight but noticeable uptrend in overall GPU clock rate. The estimated PPD as reported by the F@H client increased by 100,000 PPD. This is a small positive change (3%), which suggests there might be some benefit for GPU clock frequencies by reducing the temps, but this result isn’t statistically valid. Many more data points would be needed, using final PPD numbers and not the client’s estimated instantaneous performance, to understand the effect of the laptop cooler on F@H production. Future long-term testing of Folding on laptops with and without an external laptop cooler may be needed (but I don’t want to break my new toy so I won’t be doing much without the laptop cooler)
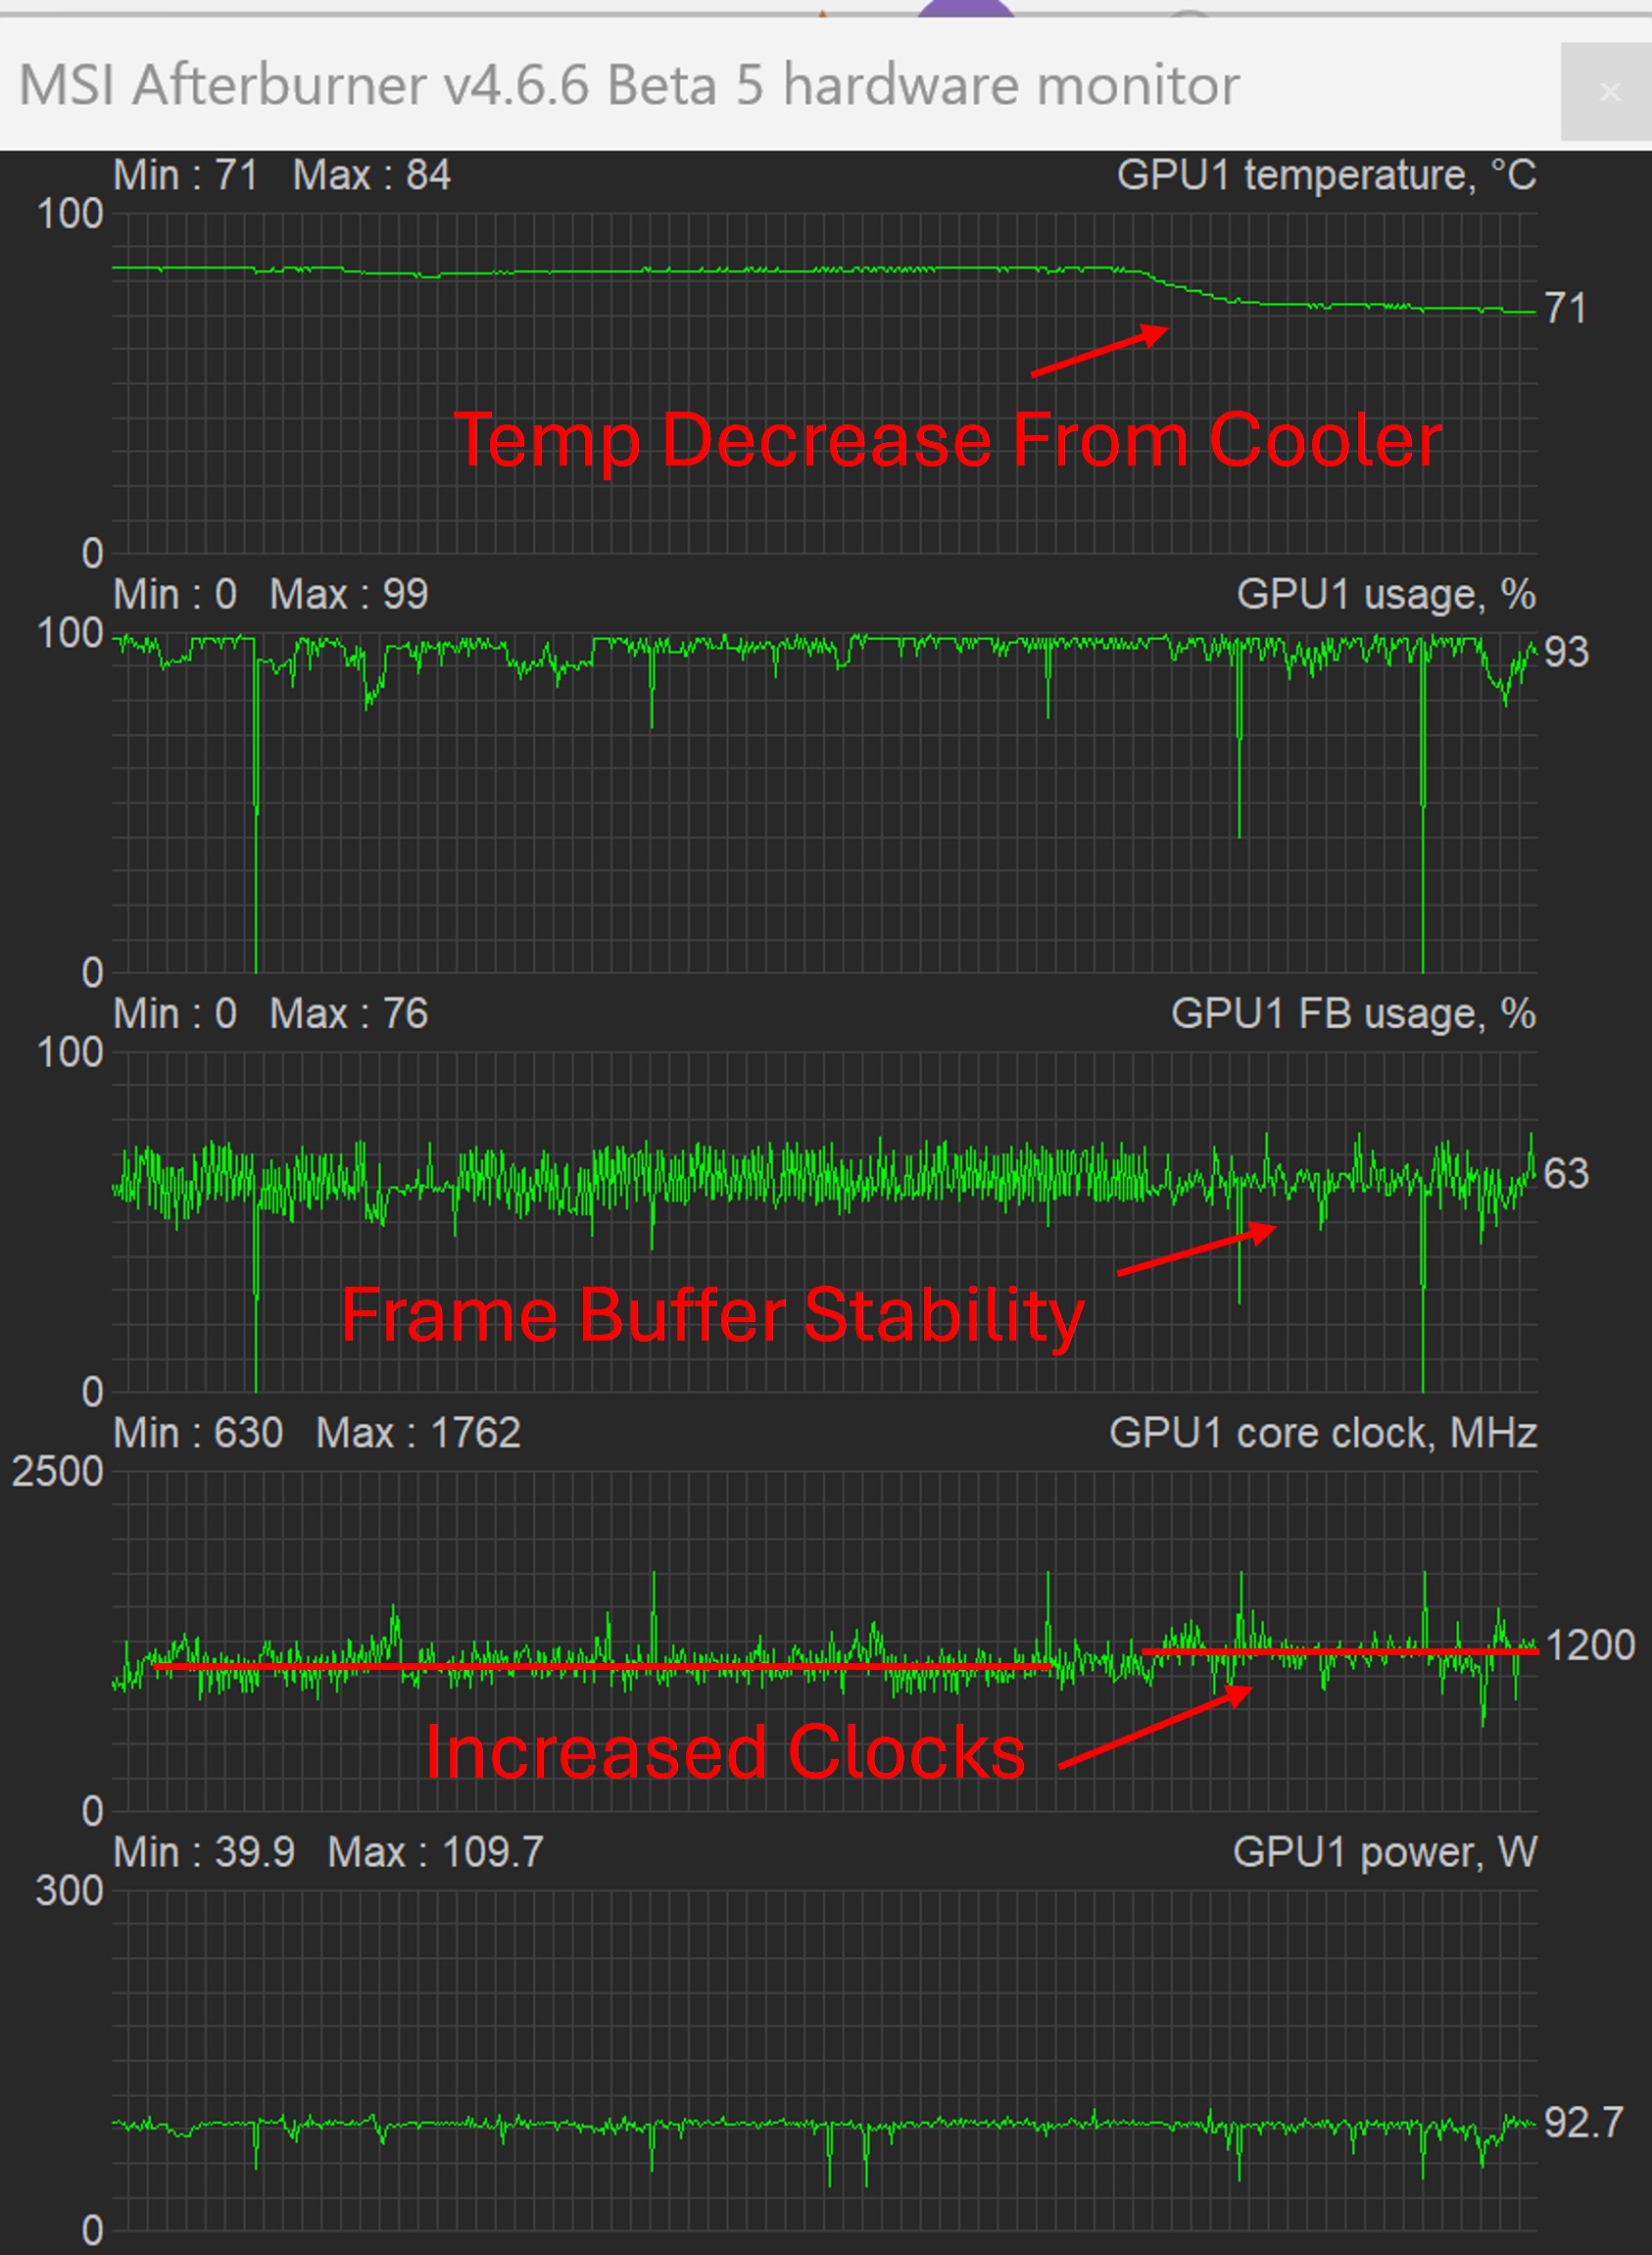
Effect of Laptop Cooler on GPU Temp, FB, and Clock Frequency during Folding@Home
Test Methodology
For this test, I’m going to run a whole bunch of workunits to get a statistically meaningful result, since Folding@Home has significant variation in PPD from one workunit to the next. In order to get a feel for how changing the GPU’s power allocation affects the results, I’m going to use Gigabyte’s Control Center to control the laptop’s power settings. This offers a more direct way than relying on Windows’ built-in power plans, although it’s not really any easier to decipher. Unfortunately, the power limit on the GPU (my main way of adjusting F@H performance and efficiency) is not adjustable in MSI Afterburner in this machine, most likely due to a locked vbios. Power consumption will be at the system level (wall power), measured by eye from the watt meter. Since this tends to jump around a bit, readings that are +/- 5 watts are essentially considered the same wattage.
Here is a screenshot of the Gigabyte Control Center. The relevant power options are boxed in red.
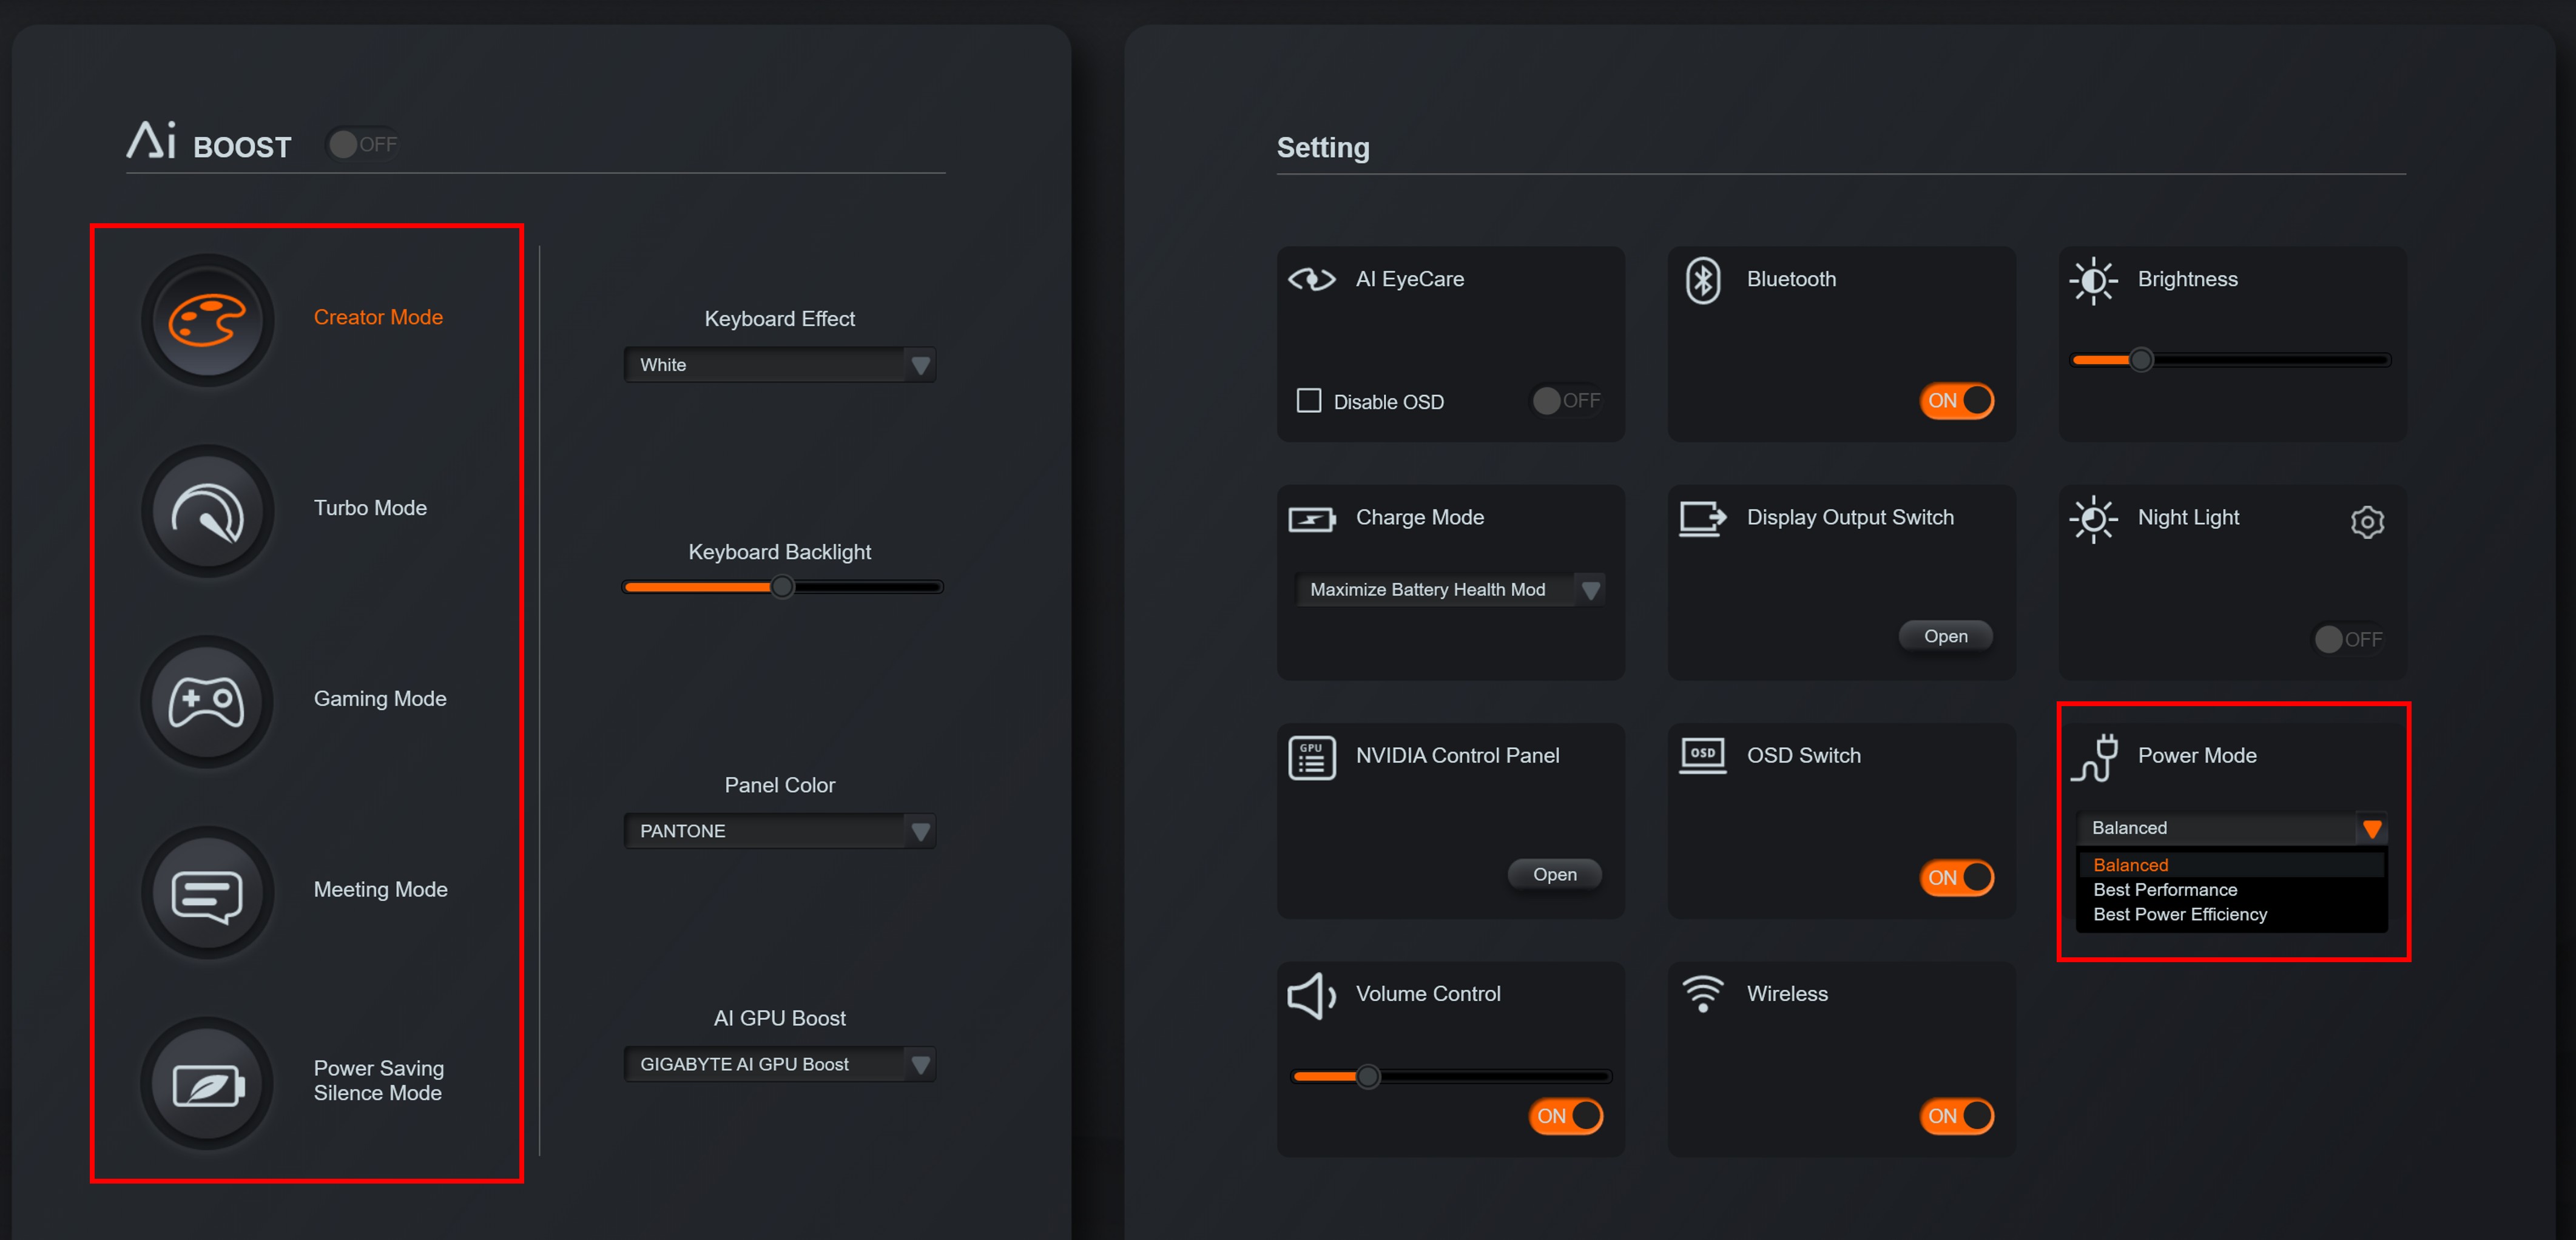
Shown on the left-hand side are five power modes for the laptop. They are “Creator Mode”, “Turbo Mode”, “Gaming Mode”, “Meeting Mode”, and “Power Saving Silence Mode”. For each power mode, there are three corresponding drop-downs under the “Power Mode” box (Balanced, Best Performance, and Best Power Efficiency”. It’s super annoying that Gigabyte named these things the same. Do the power modes on the right modify the power modes on the left? Do they override them? The documentation is not very clear.
After playing around with these settings, I found very that the “big” power modes on the left do noticably change the GPU power consumption (as reported in MSI Afterburner). For example, when in “Gaming” or “Turbo” mode, the GPU would hit up to 105-110 watts (compared to the Windows Default of 95 watts). When set to Creator mode, it would hover between 80 and 90 watts. Meeting Mode and Power Saving mode further reduced the GPU to about 80 watts continuous.
Frustratingly, the effect of the power mode drop-downs was less evident.
To sort all this out, I’m going to primarily focus on the five major power modes on the left side of the control panel, since those seemed to actually do something. I’m going to run five work units under each power mode and record the instantaneous PPD and Wattage at the midpoint of each run, as shown in the client. Within each work unit, I will also vary the “little” power mode setting at three discrete points during the solve and record the results. This will determine if the little modes do anything.
Overall, this will produce 5 x 5 x 3 = 75 data points, which should be enough to draw some general conclusions about this laptop and hopefully enough to determine the best settings for energy efficiency on this machine. Longer-term testing using statistics reported to the Folding@Home collections server will be done to verify the most efficient setting.
Here is an example of the test matrix that will be used to capture data for each setting:
Alright, I’ve got the machine up and running and a test plan. Now all we need to do is camp out and take some data. This will take some time (probably a week or two). Stay tuned for Part II of this article (Test Results)!