(A Folding at Home Unofficial Configuration Guide for GPU, Multi-GPU, and CPU/GPU Folding)
Folding@Home is a distributed computing project for fighting diseases. If you’re reading this post, they you are probably looking for some help getting Folding@Home running on your graphics card. GPU folding, when configured properly, is one of the best way to do tons of science efficiently. I hope this Folding@Home GPU Guide helps you start kicking butt against cancer and other diseases. So, let’s get started.
Note: for people who already have the Folding@Home client up and running and you want to switch from CPU folding to GPU folding, skip right to Step 3. Please note that if you are changing your hardware configuration on a machine that is already folding, it is courteous to let the existing work units finish by using the “finish” option on the client prior to re-arranging hardware. This keeps work units from being lost.
Step 0: System Requirements
Yes, we’re starting at zero, because computer indexing starts here too. Plus, before you even try this, you need the right stuff in the box.
Operating System
While Folding@Home supports many operating systems, this guide is aimed at Windows users. I’ll be using Windows 10, but the steps are the same for Windows 7.
Overall Computer
CPU

You do need to think about what goes in this socket, even if you’re GPU folding
Even though this is a guide about graphics card folding, the rest of your computer needs to be up to snuff to keep the card fed. Ideally, you want one dedicated CPU core for your overall Windows environment, plus one CPU core for each graphics card you want to run F@H on. So, for a 1-GPU computer, having two CPU cores available is optimal. A dual-GPU computer should have a 3 cores available, a three-GPU computer should have four cores available, etc. In terms of clock rate, almost all modern processors with clock rates above 2.0 GHz will work. Remember, we aren’t doing CPU folding here; the CPU just needs to be fast enough to keep the GPU fed.
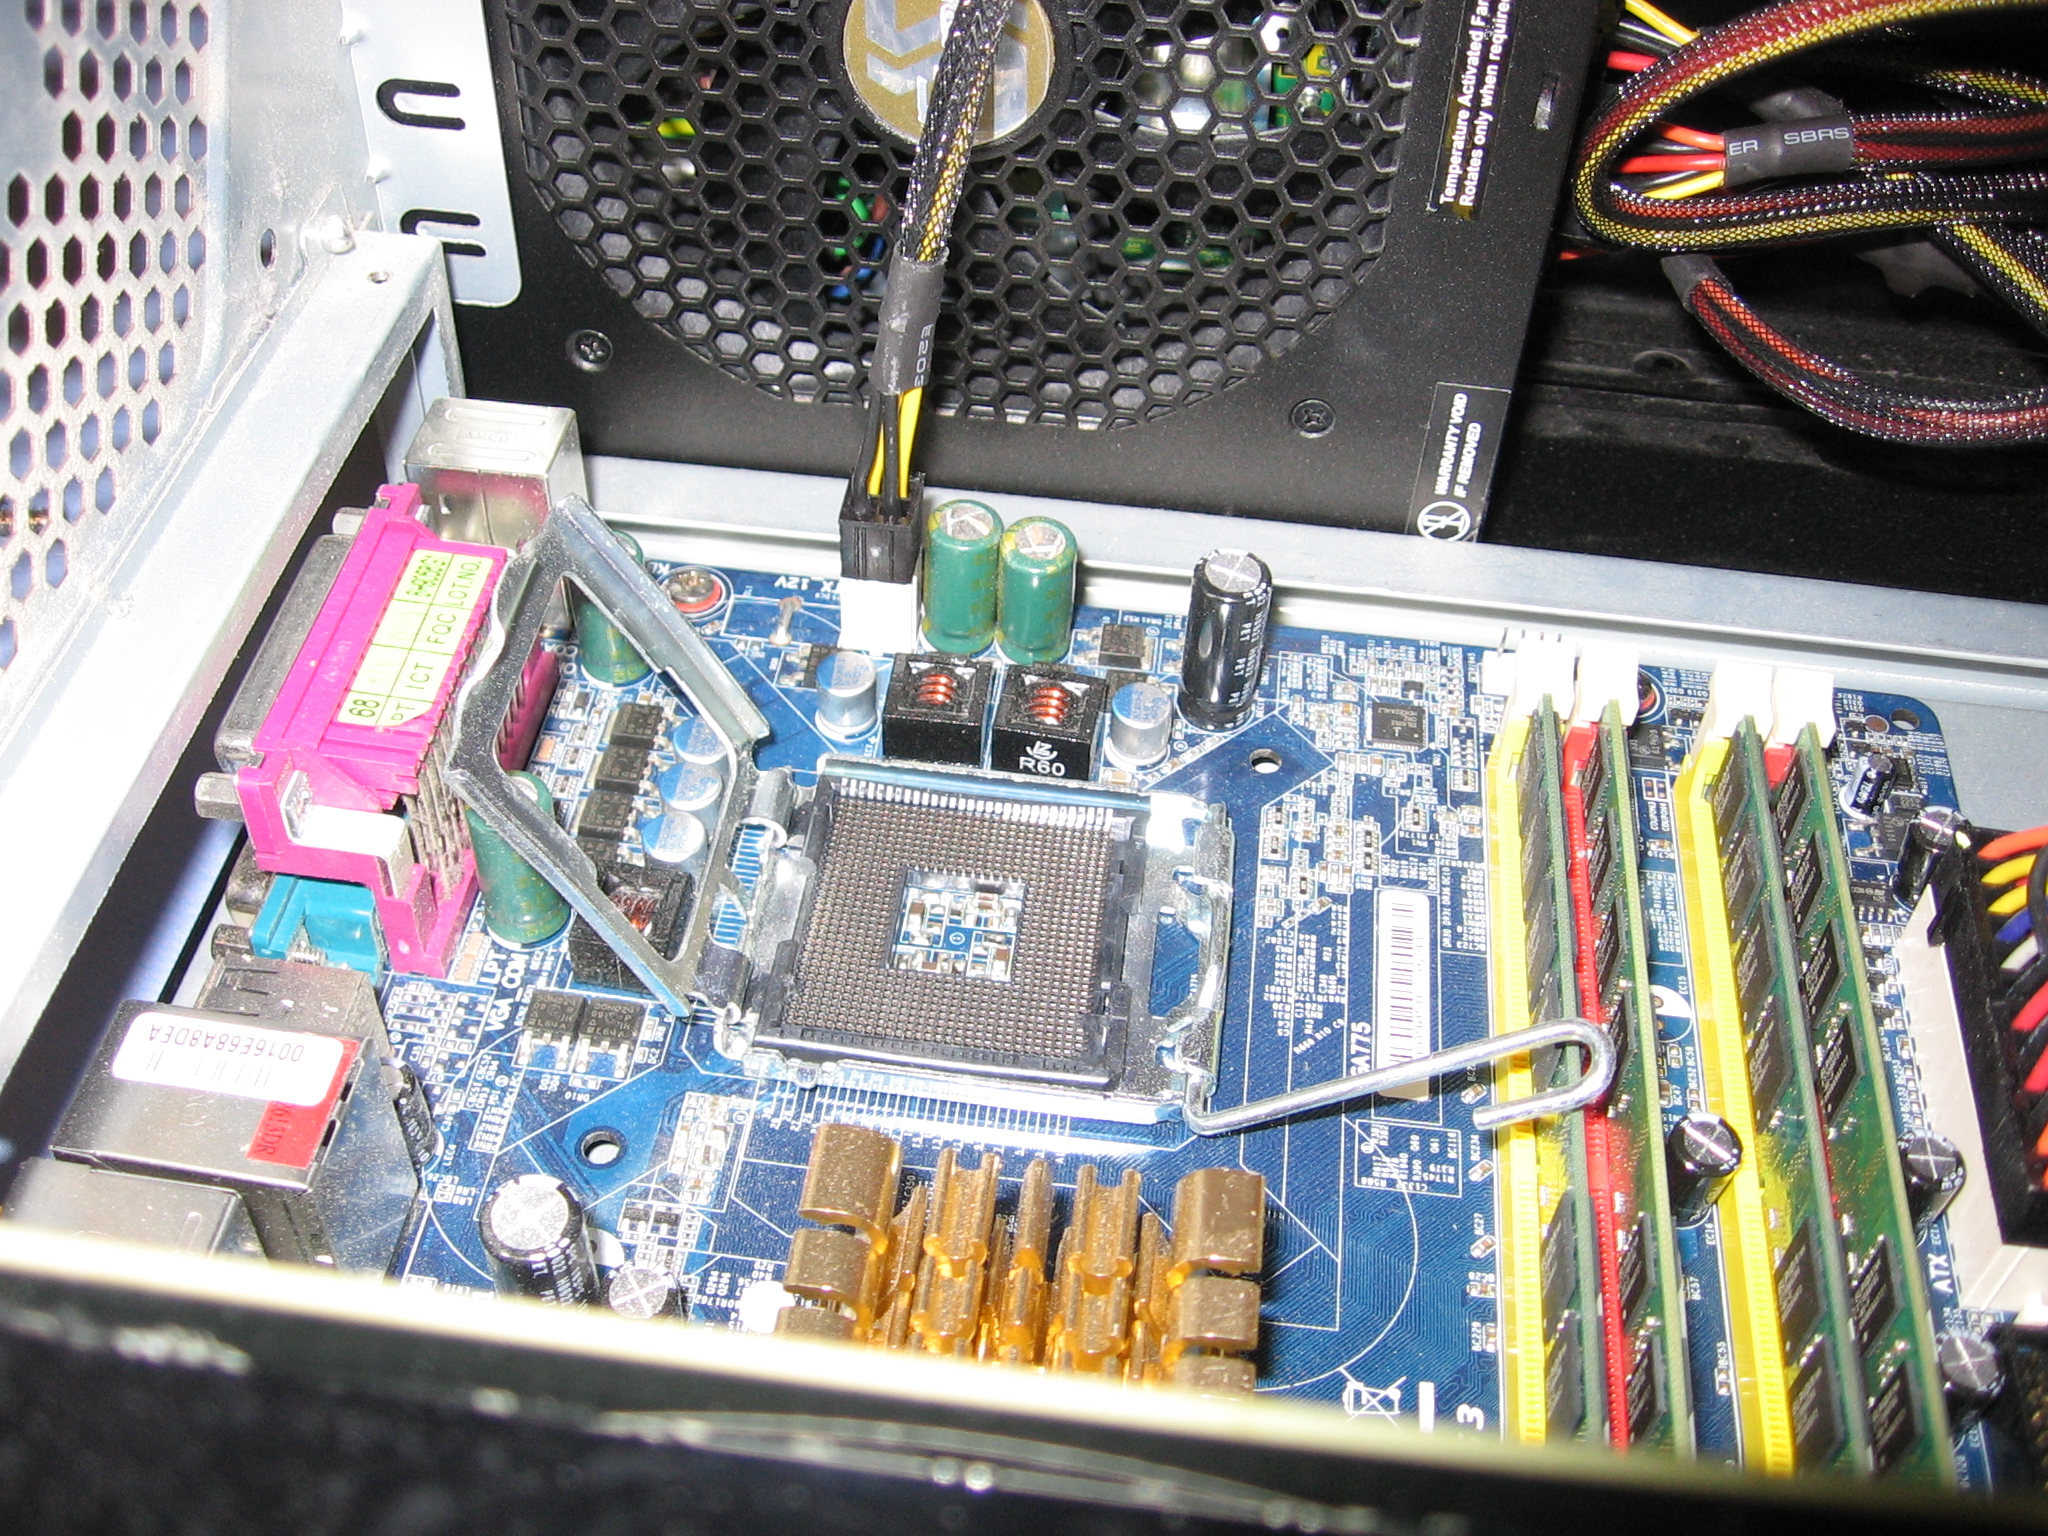
Motherboard
Circuit City
Motherboards don’t matter too much, except that you should have a full-width PCI-Express x16 slot for each graphics card you want to fold on. When you get into really fast, new graphics cards like the RTX 2080, a PCI-E 3.0 x16 slot will ensure the data flows fast enough to the card. PCI-Express 2.0 bandwidth will work with these ultra-fast cards, but there will be a slight bottleneck. Note I have never seen any bottlenecks with my GTX 1080 Ti on PCI-Express 2.0 x16 in Windows, but when adding a second card (using an x1 riser), I did see a slowdown on my Gigabyte 880-series socket AM3 board.
Memory
You should also aim to have 8 GB of ram (16 ideally), just because Windows tends to be a resource hog. Some people can fold just fine with 4 GB, but for this guide I am assuming you want to be able to use the machine as well. Memory channel configuration and speed doesn’t matter very much for Folding@Home, especially on GPUs.
Hard Drives
Any old hard drive with 60 GB or so of free space will do. The F@H client takes up almost no space. The 60 GB of free space is really just what you need for Windows 10 to not run really bad, regardless of what the machine is being used for.
Internet Connection
Almost anything works, as long as it doesn’t drop out.
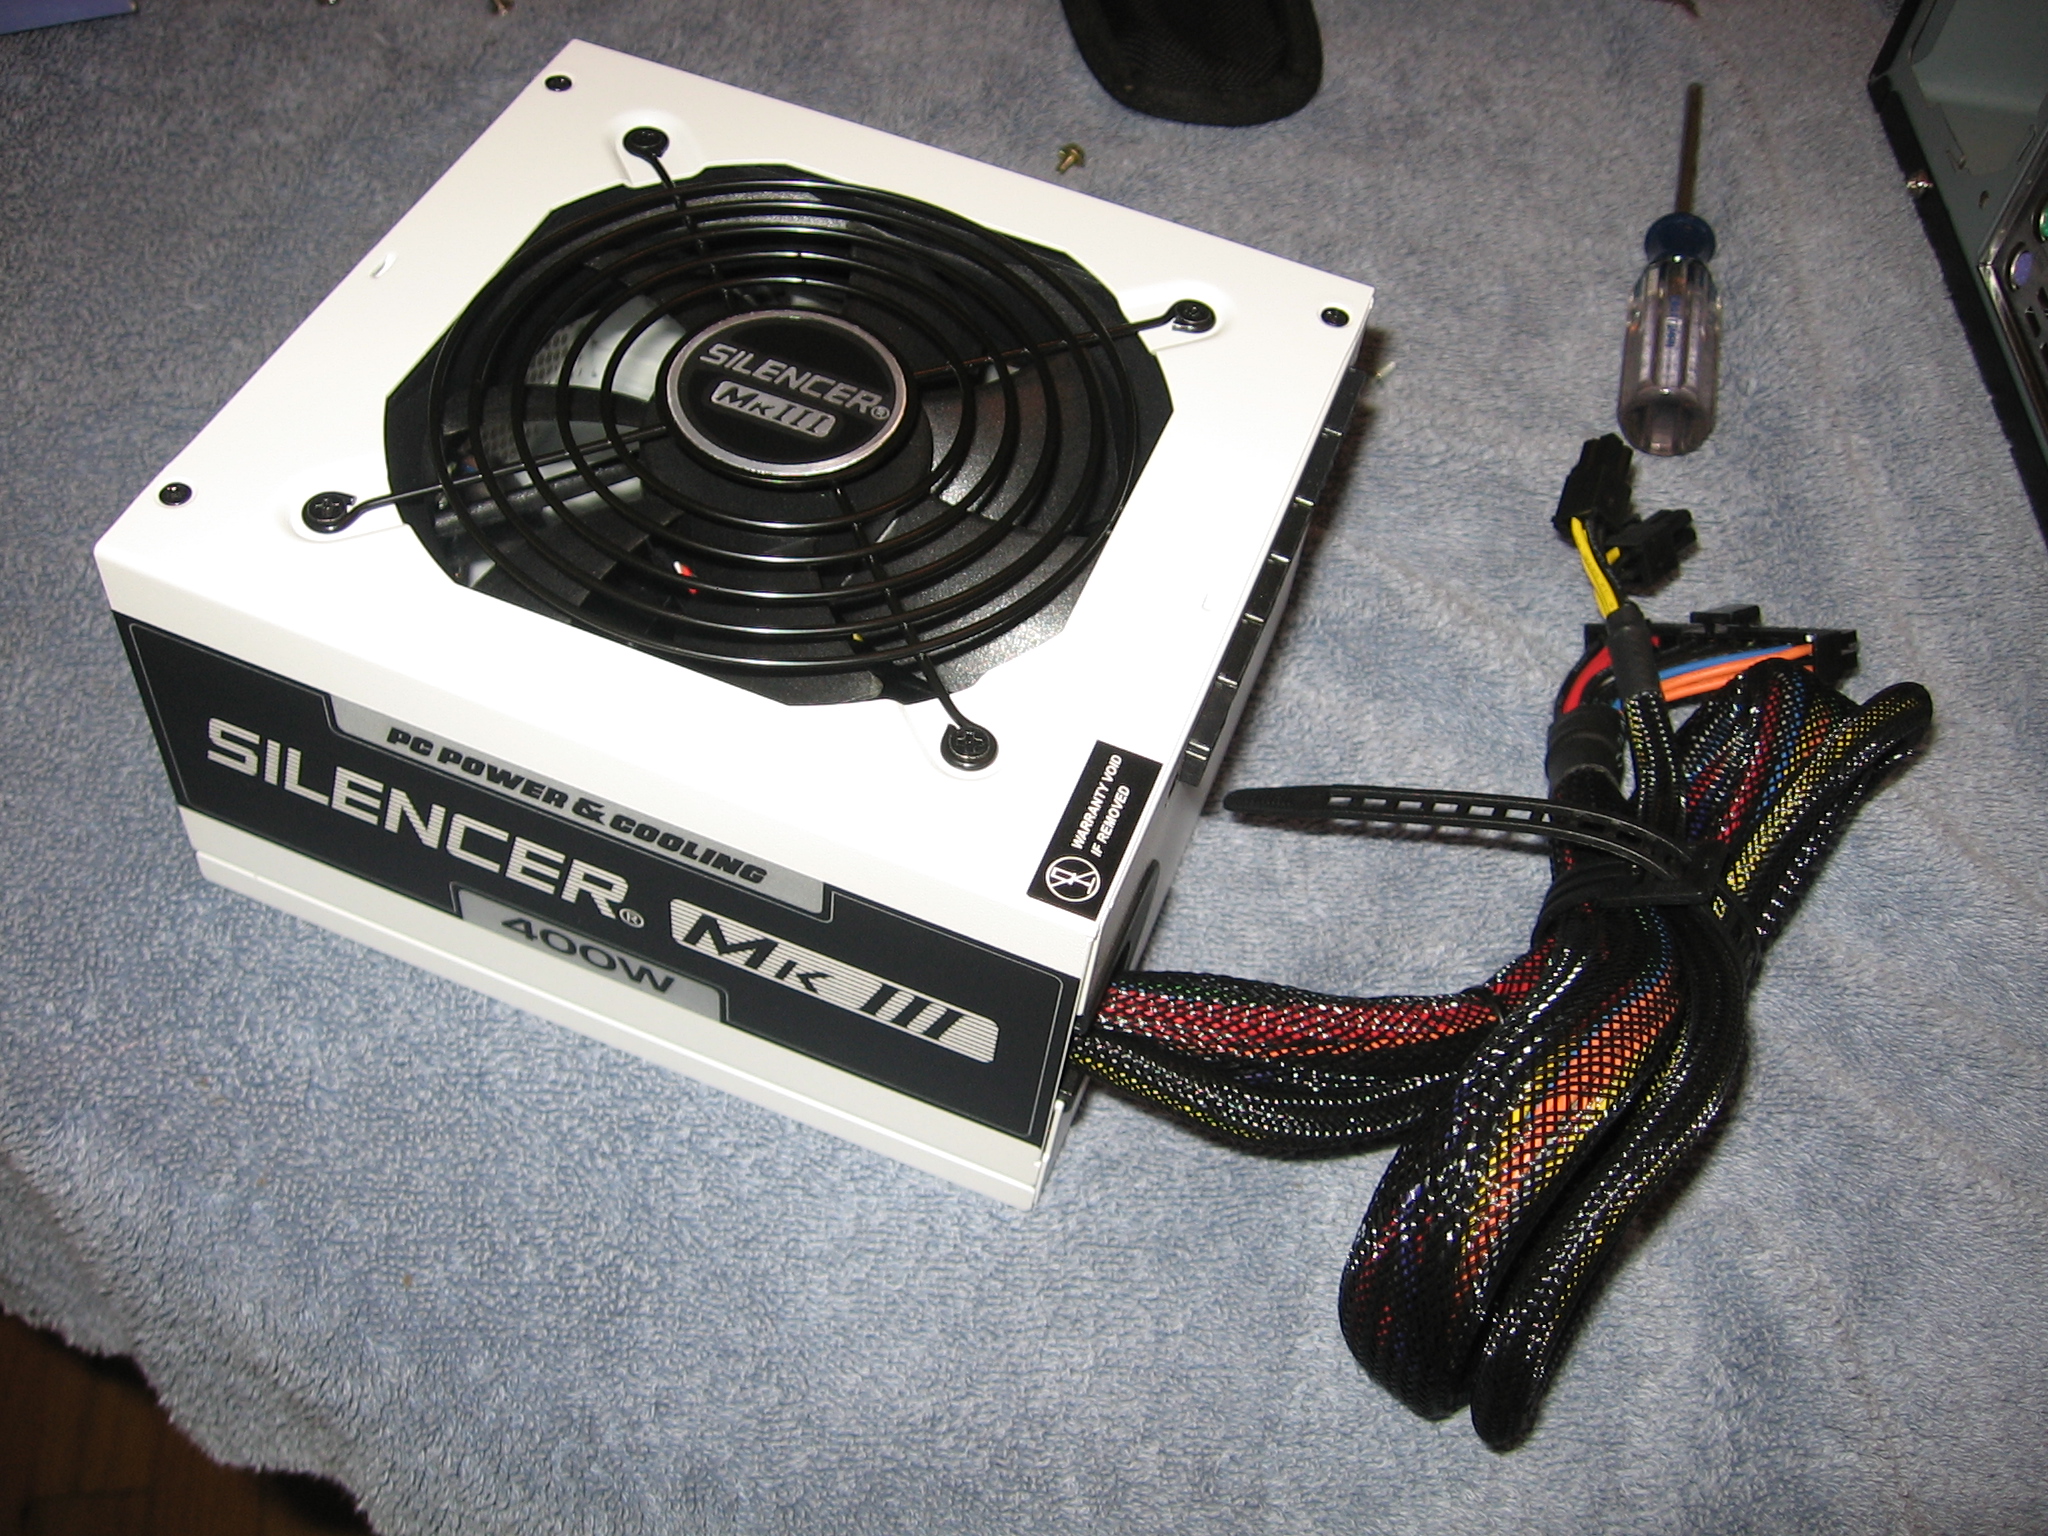
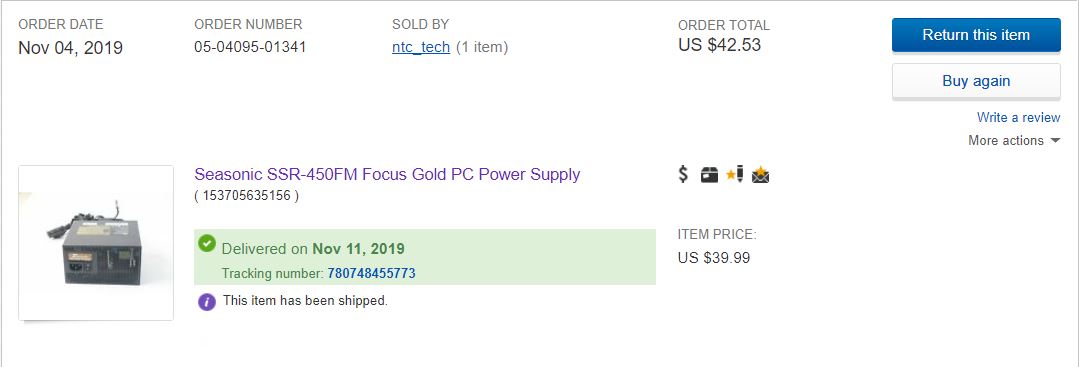
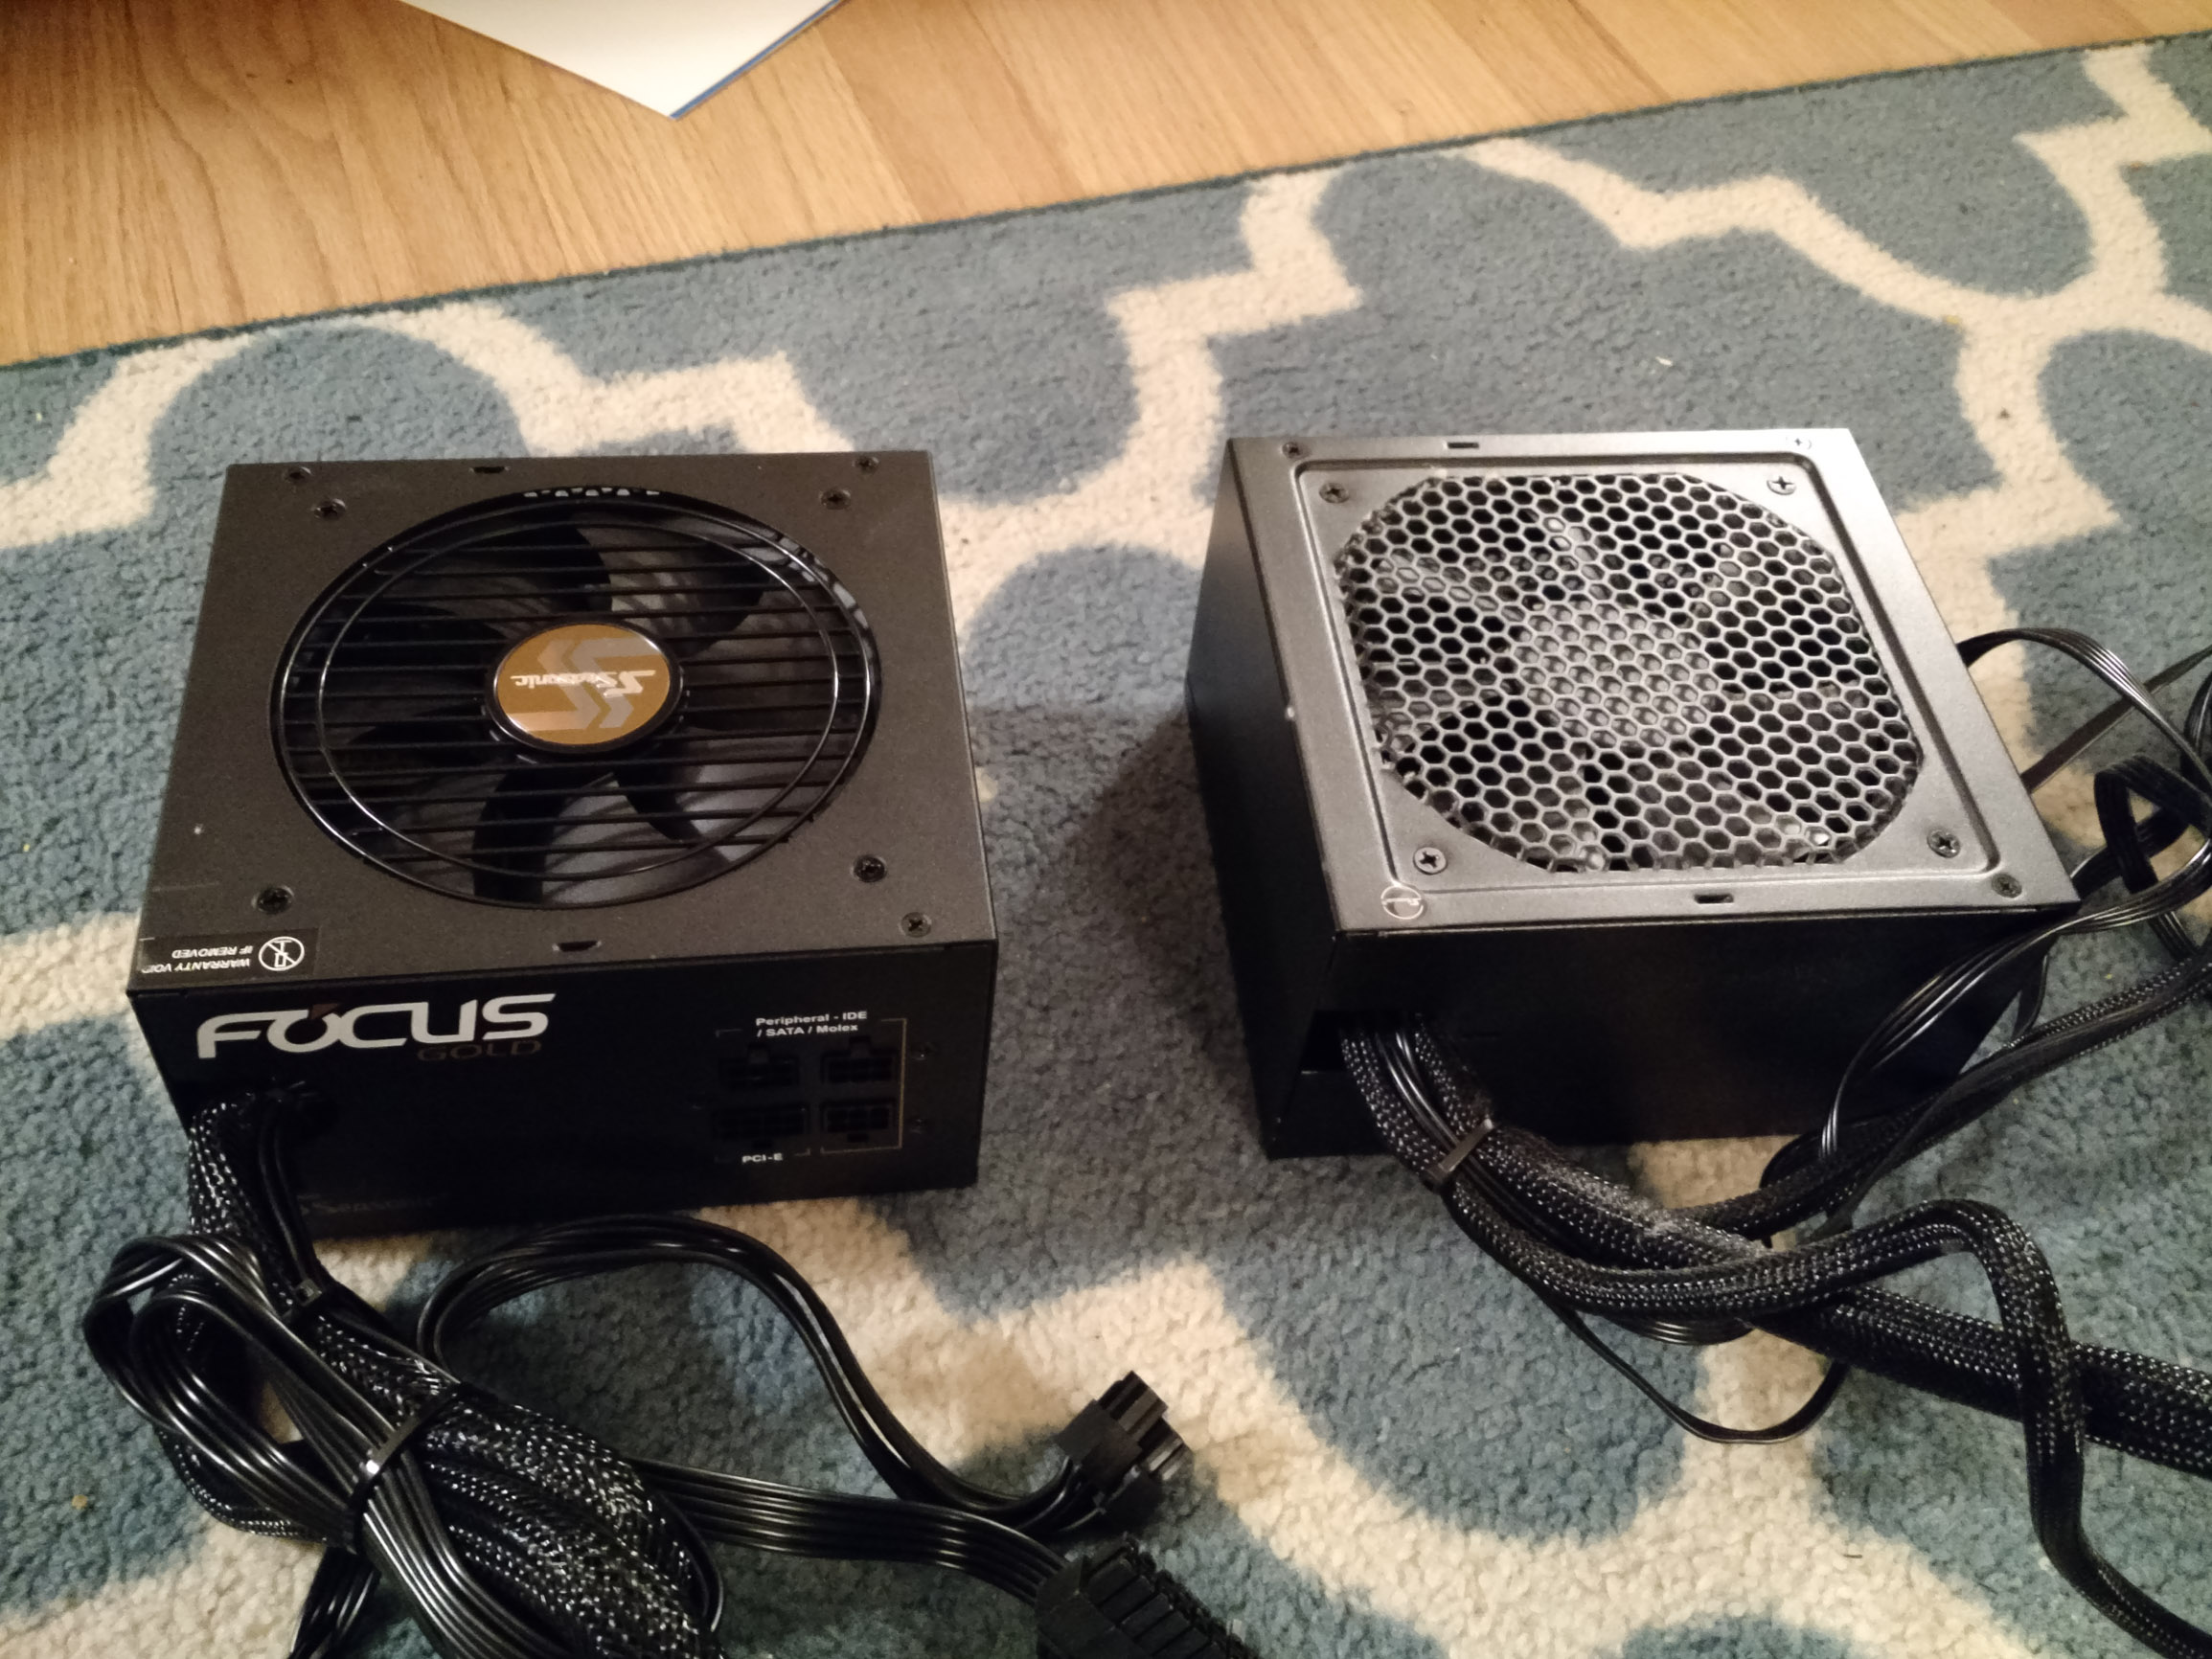
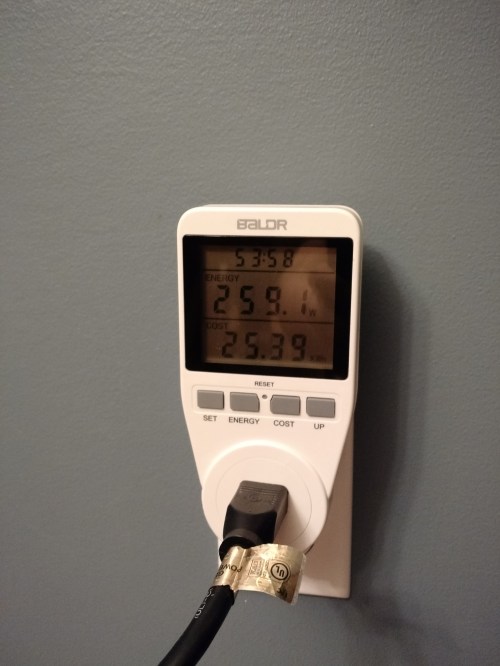
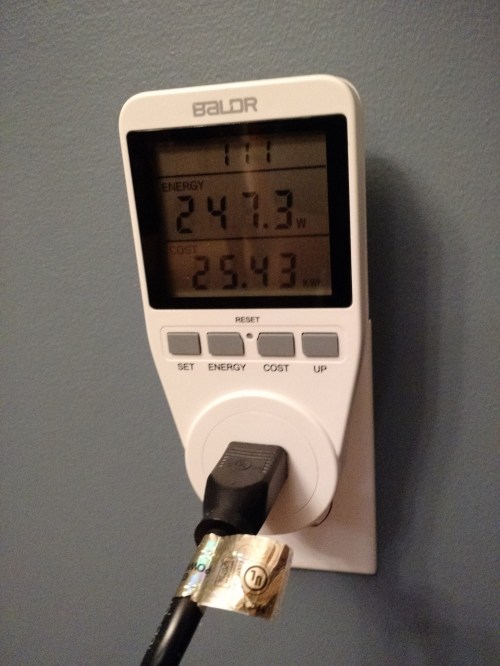
Power Supply

PC Power & Cooling SILENCER PSU
This is a critical and often overlooked component in the world of computational computing. I’ve written many articles on power supplies, so feel free to browse through my site to learn more. In short, make sure your system has enough PSU wattage to drive the video card, based on the video card’s recommendation. You’ll also need to make sure your power supply has the correct auxiliary power cables (PCI-Express 6-pin and/ or 8-pin) to supply enough current to cards requiring supplemental power.
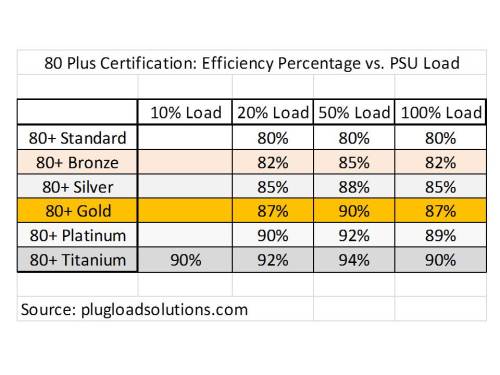
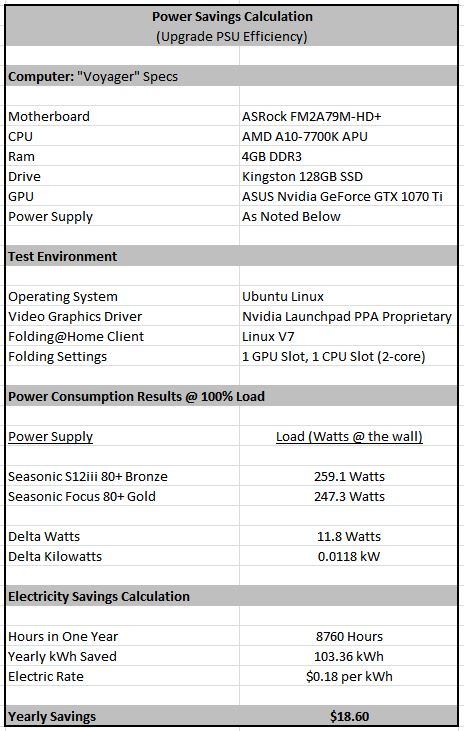
For multiple cards, you’ll need more nameplate PSU wattage. Power supplies should be 80+ Bronze certified or better to help deliver power efficiently, because no one likes wasting money on misused electricity (and this hurts the environment). Also, you should try and stick with major manufacturers, such as (but not limited to) Corsair, Antec, Seasonic, Cooler Master, PC Power & Cooling, Thermaltake, etc.
Here are some common computer configurations and a reasonable power supply wattage to drive them:
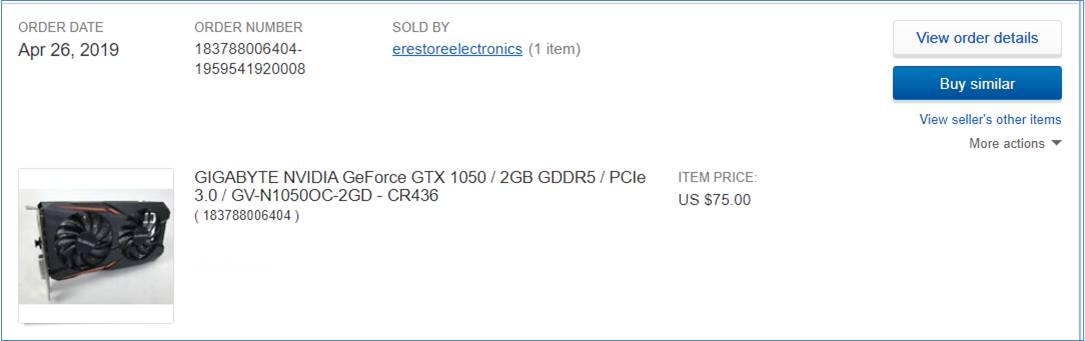
- 1 x Low-End GPU –> (GTX 1050, RX560, etc) –> 380 Watt PSU
- 1 x Mid-Range GPU (GTX 1060, RX570, etc) –> 450 Watt PSU
- 1 x High-End GPU (GTX 1080, Vega64, etc) –> 550 Watt PSU
- 2 x Mid-Range GPUs or 3 x Low-End GPUs–> 600 Watt PSU
- 2 x High-End GPUs or 3 x Mid-Range GPUs –> 800 Watt PSU
- 3 x High-End GPUs or 4 x Mid-Range GPUs–> 1000 Watt PSU
- 4 x High-End GPUs (you’re crazy!) –> 1200+ Watt PSU
Saving the Planet Tip: Any PSU supplying an active load of 600 Watts or more should be 80+ Gold certified or better. This will minimize waste heat due to efficiency losses, which really start to add up for high power-draw computers.
Cooling
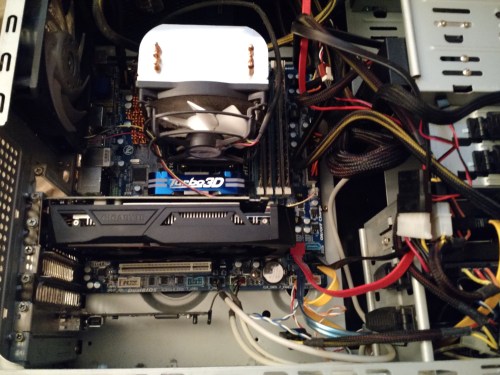
This is another overlooked requirement. Any computer doing 24/7 computations on a graphics card is going to get pretty toasty. Thankfully, most modern CPU cases come with enough space and fans to deal with this. You’ll want at least 1 dedicated 120 MM exhaust fan (not including the PSU fan) and one 120 MM intake fan to keep the air flowing. If you have dual graphics cards, having an intake fan right on the side panel blowing on the cards is one of the best way to keep a hot pocket of air from forming between the cards. Consider reference-style video cards (centrifugal 2-slot blower coolers) for multi-card setups to help dump the heat, since open-fan cards tend to just drown in their own heat if there isn’t enough airflow. I also recommend aftermarket coolers on CPUs, since your processor will be actively spooled up and feeding your graphics card. Yet, CPU cooling doesn’t need to be overkill.
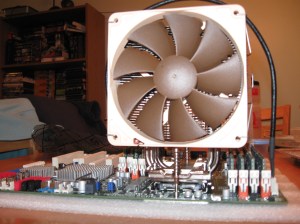
NOCTUA OVERKILL!
Graphics Card
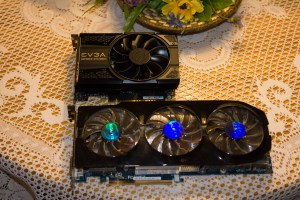
Graphics Cards: You’ll Need One
First off, you should actually have a discrete graphics card. While F@H might run on some onboard / APU graphics solutions, the performance won’t be worth it, and you might as well just run CPU folding.
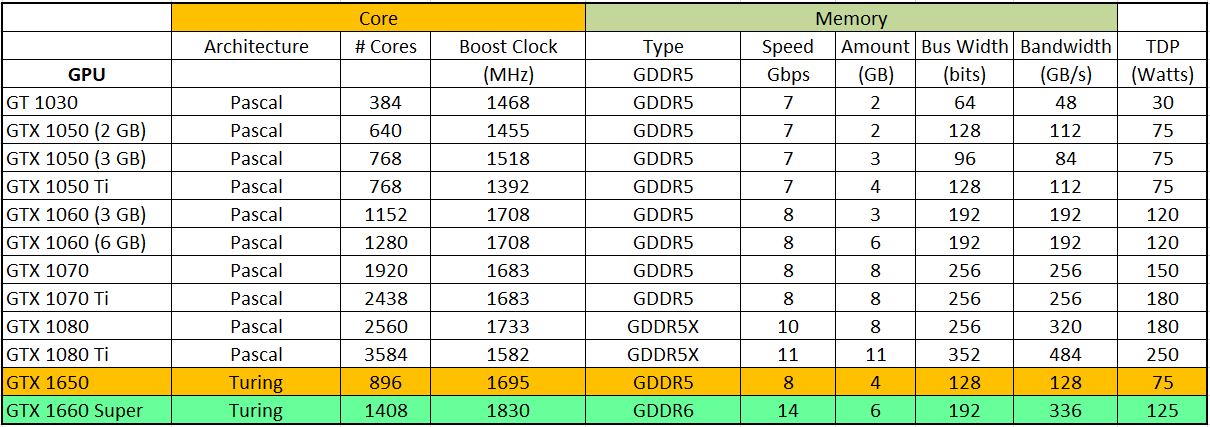
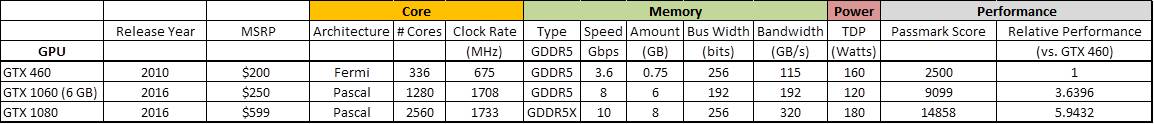
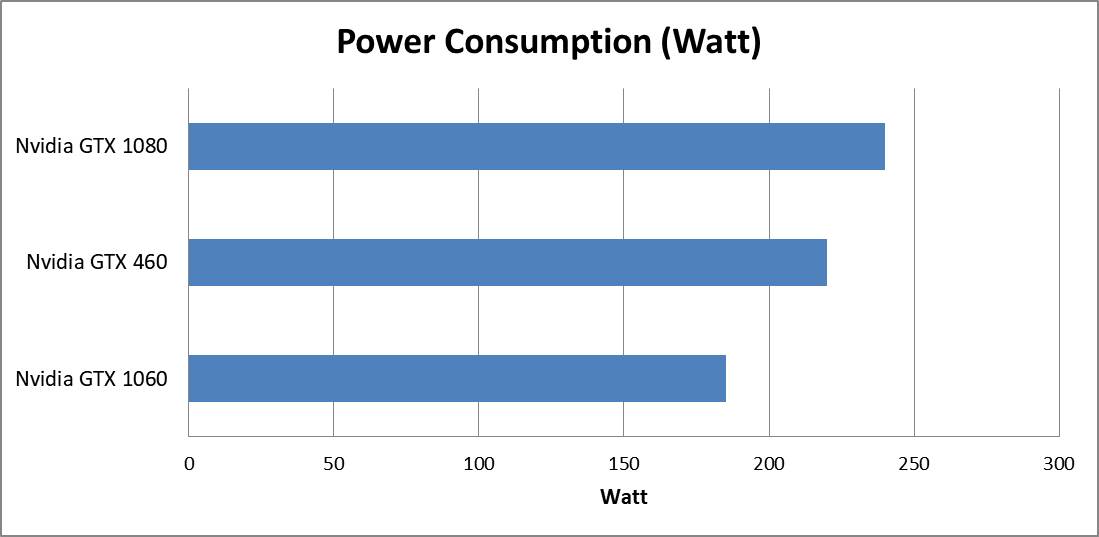
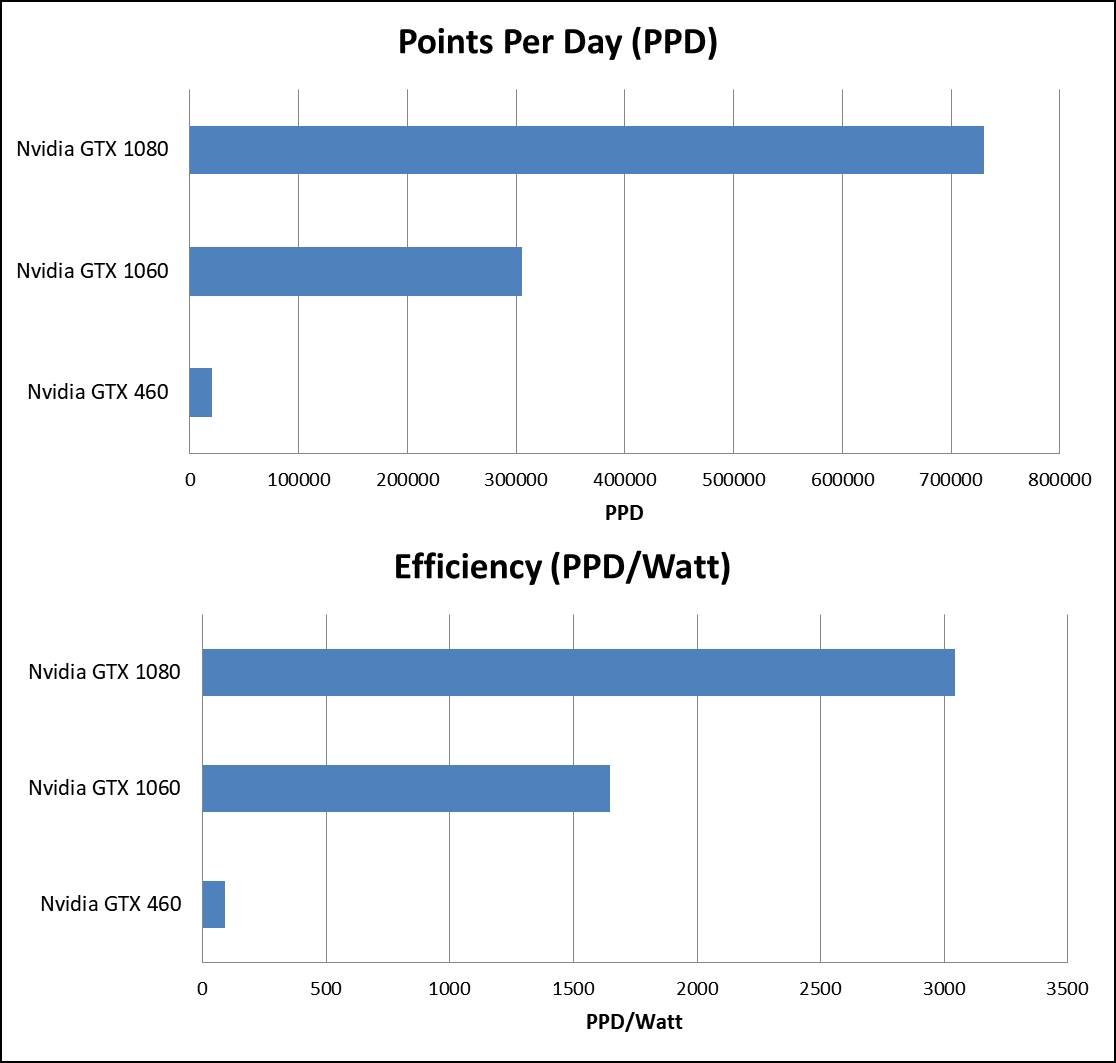
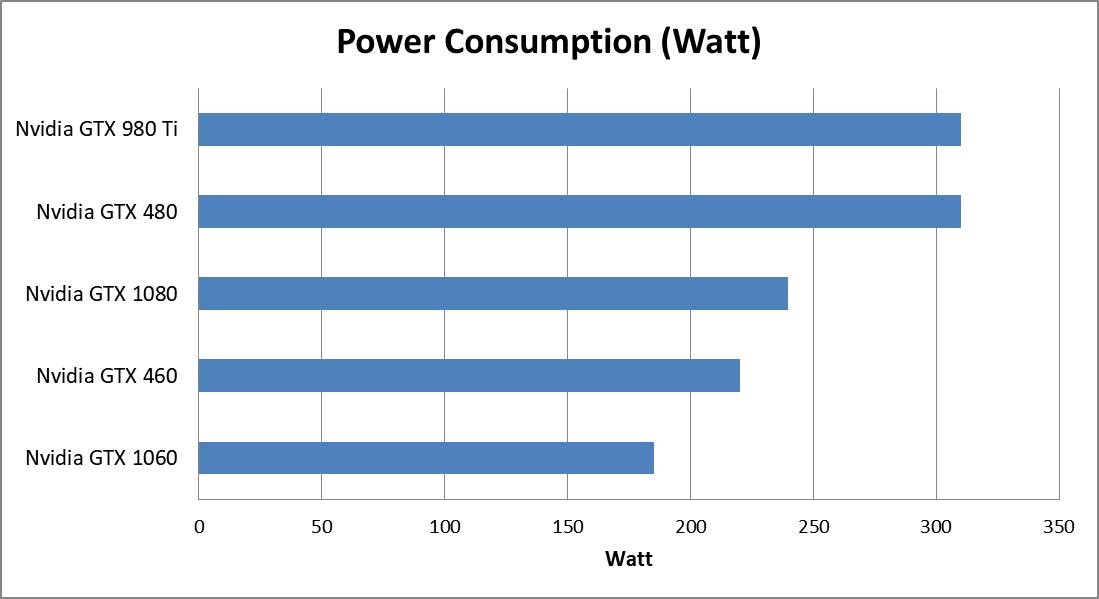
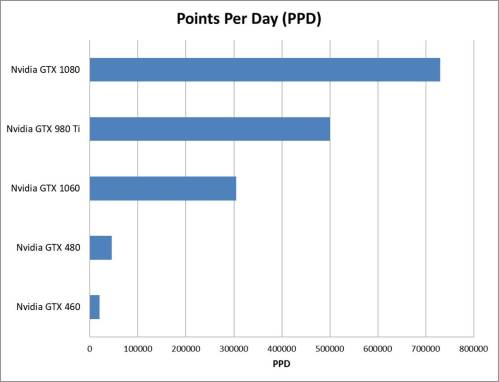
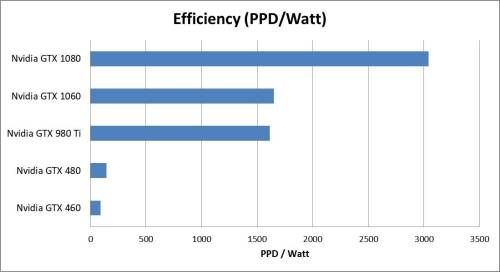
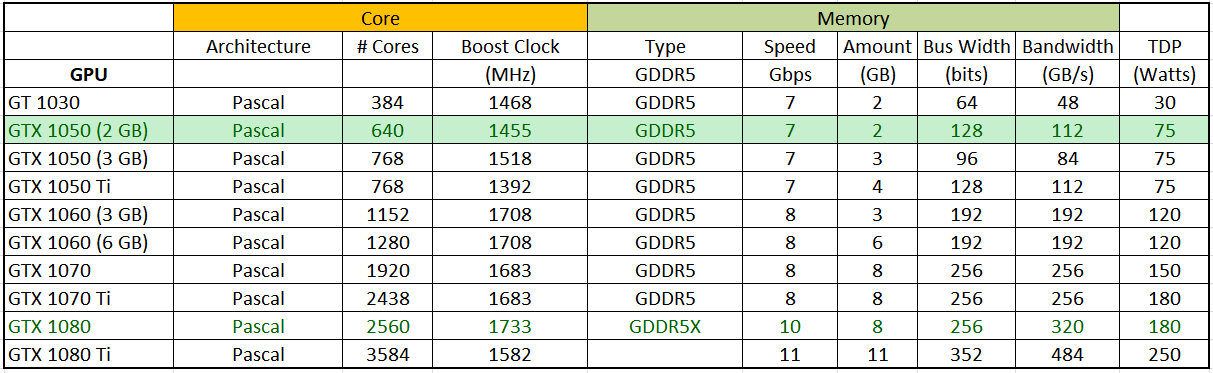
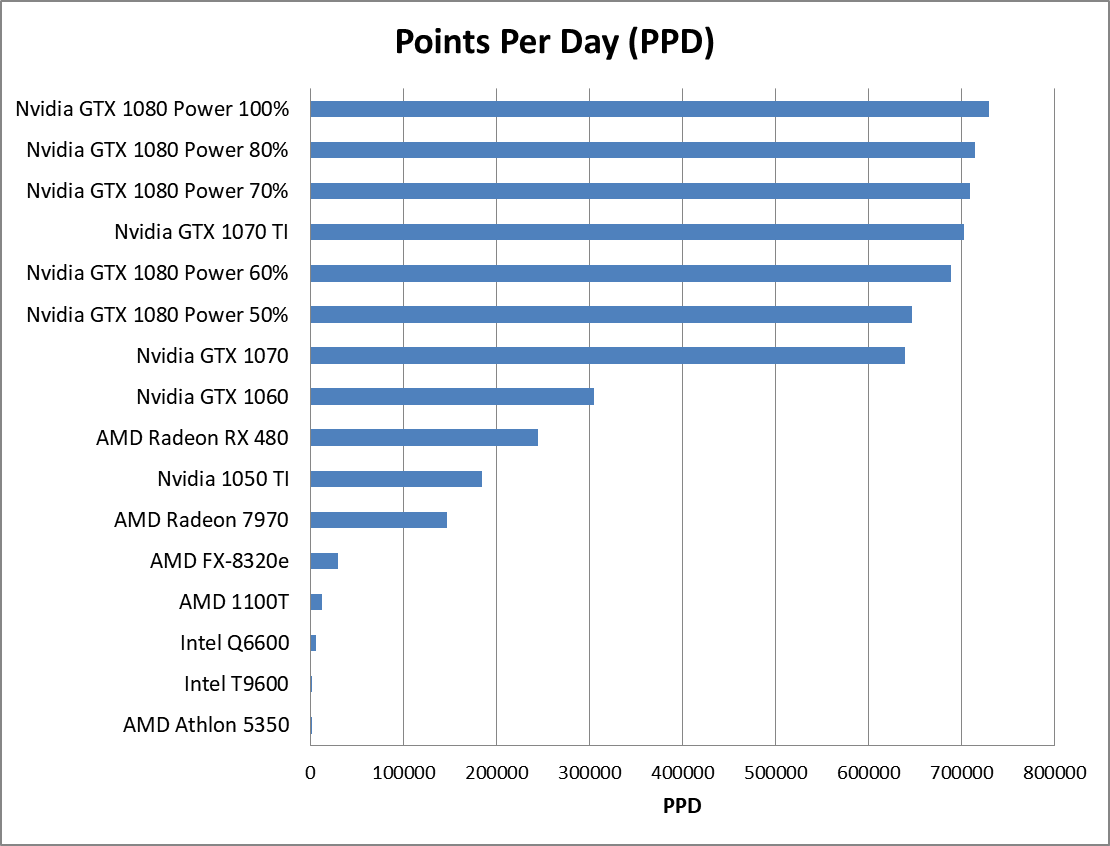
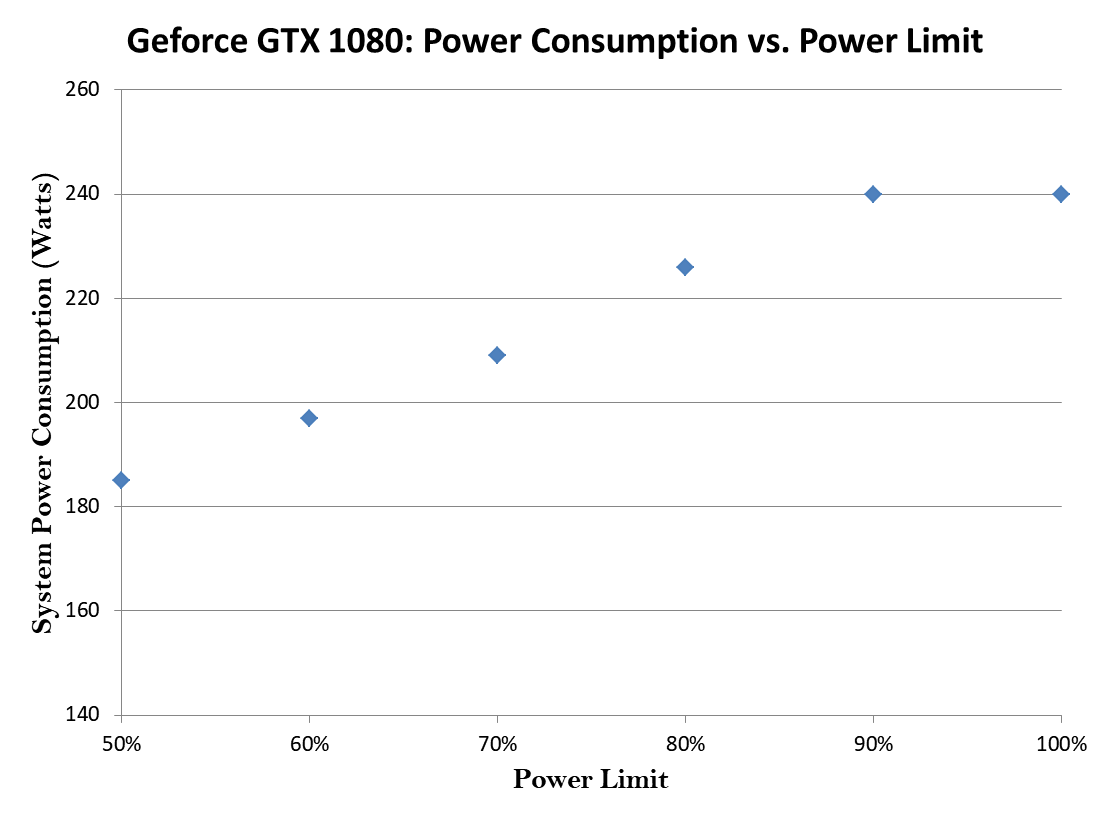
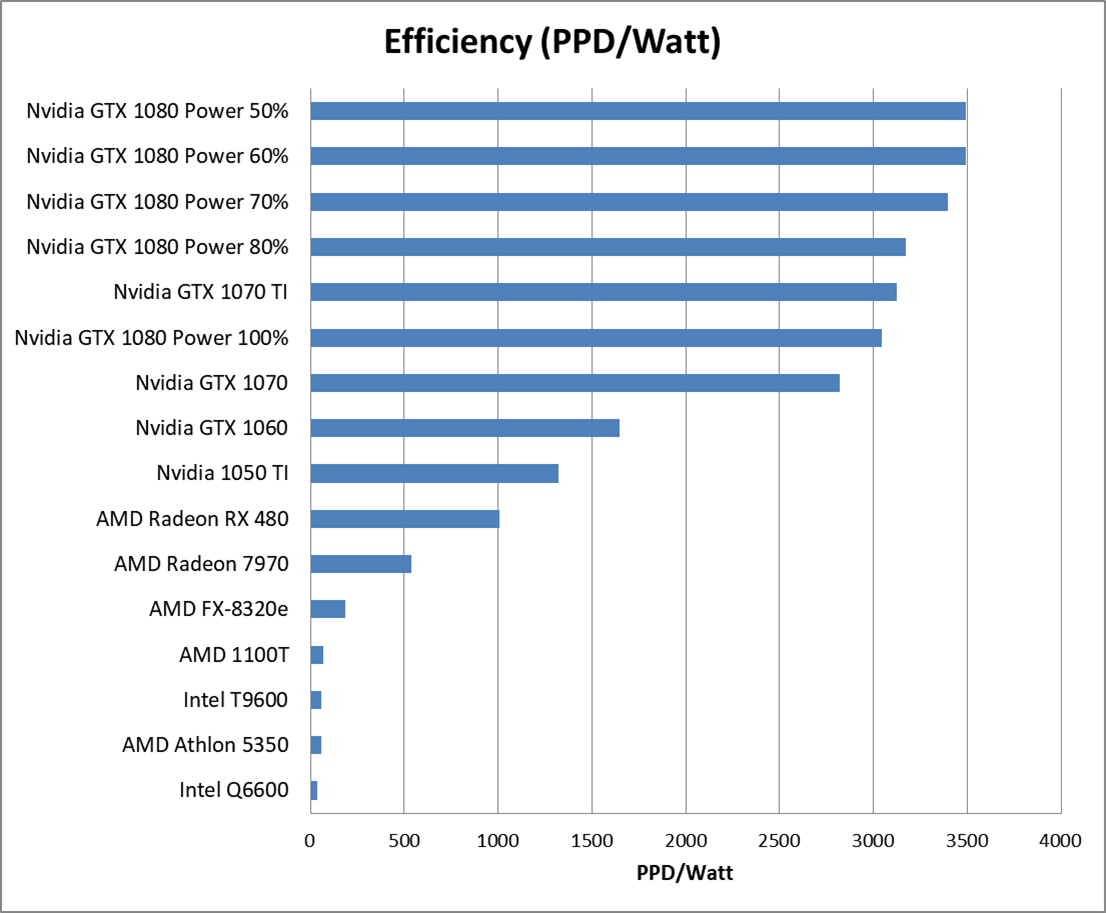
Folding@Home works on many discrete graphics cards that support OpenCL, but not all cards are supported. AMD RADEON HD 5xxx cards and Nvidia GeForce 4xx cards and newer are currently supported, but that can always change. See the project’s system requirements for a complete list. I personally recommend using Nvidia 9xxx series cards or AMD RX 5xx cards or newer, since these are more efficient than older hardware. My review of the GeForce 1080 Ti has some plots on efficiency and performance that might be helpful if you are selecting a card specifically for folding. Make sure you have the latest drivers for your card from either AMD or Nvidia.
Step 1: System Prep
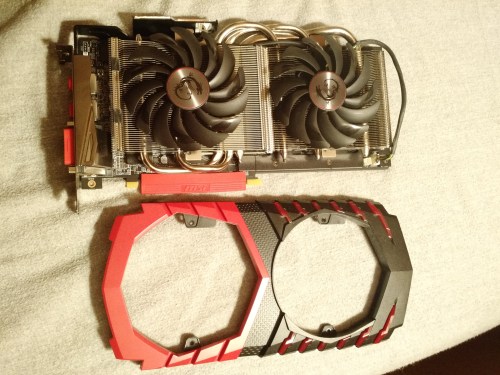
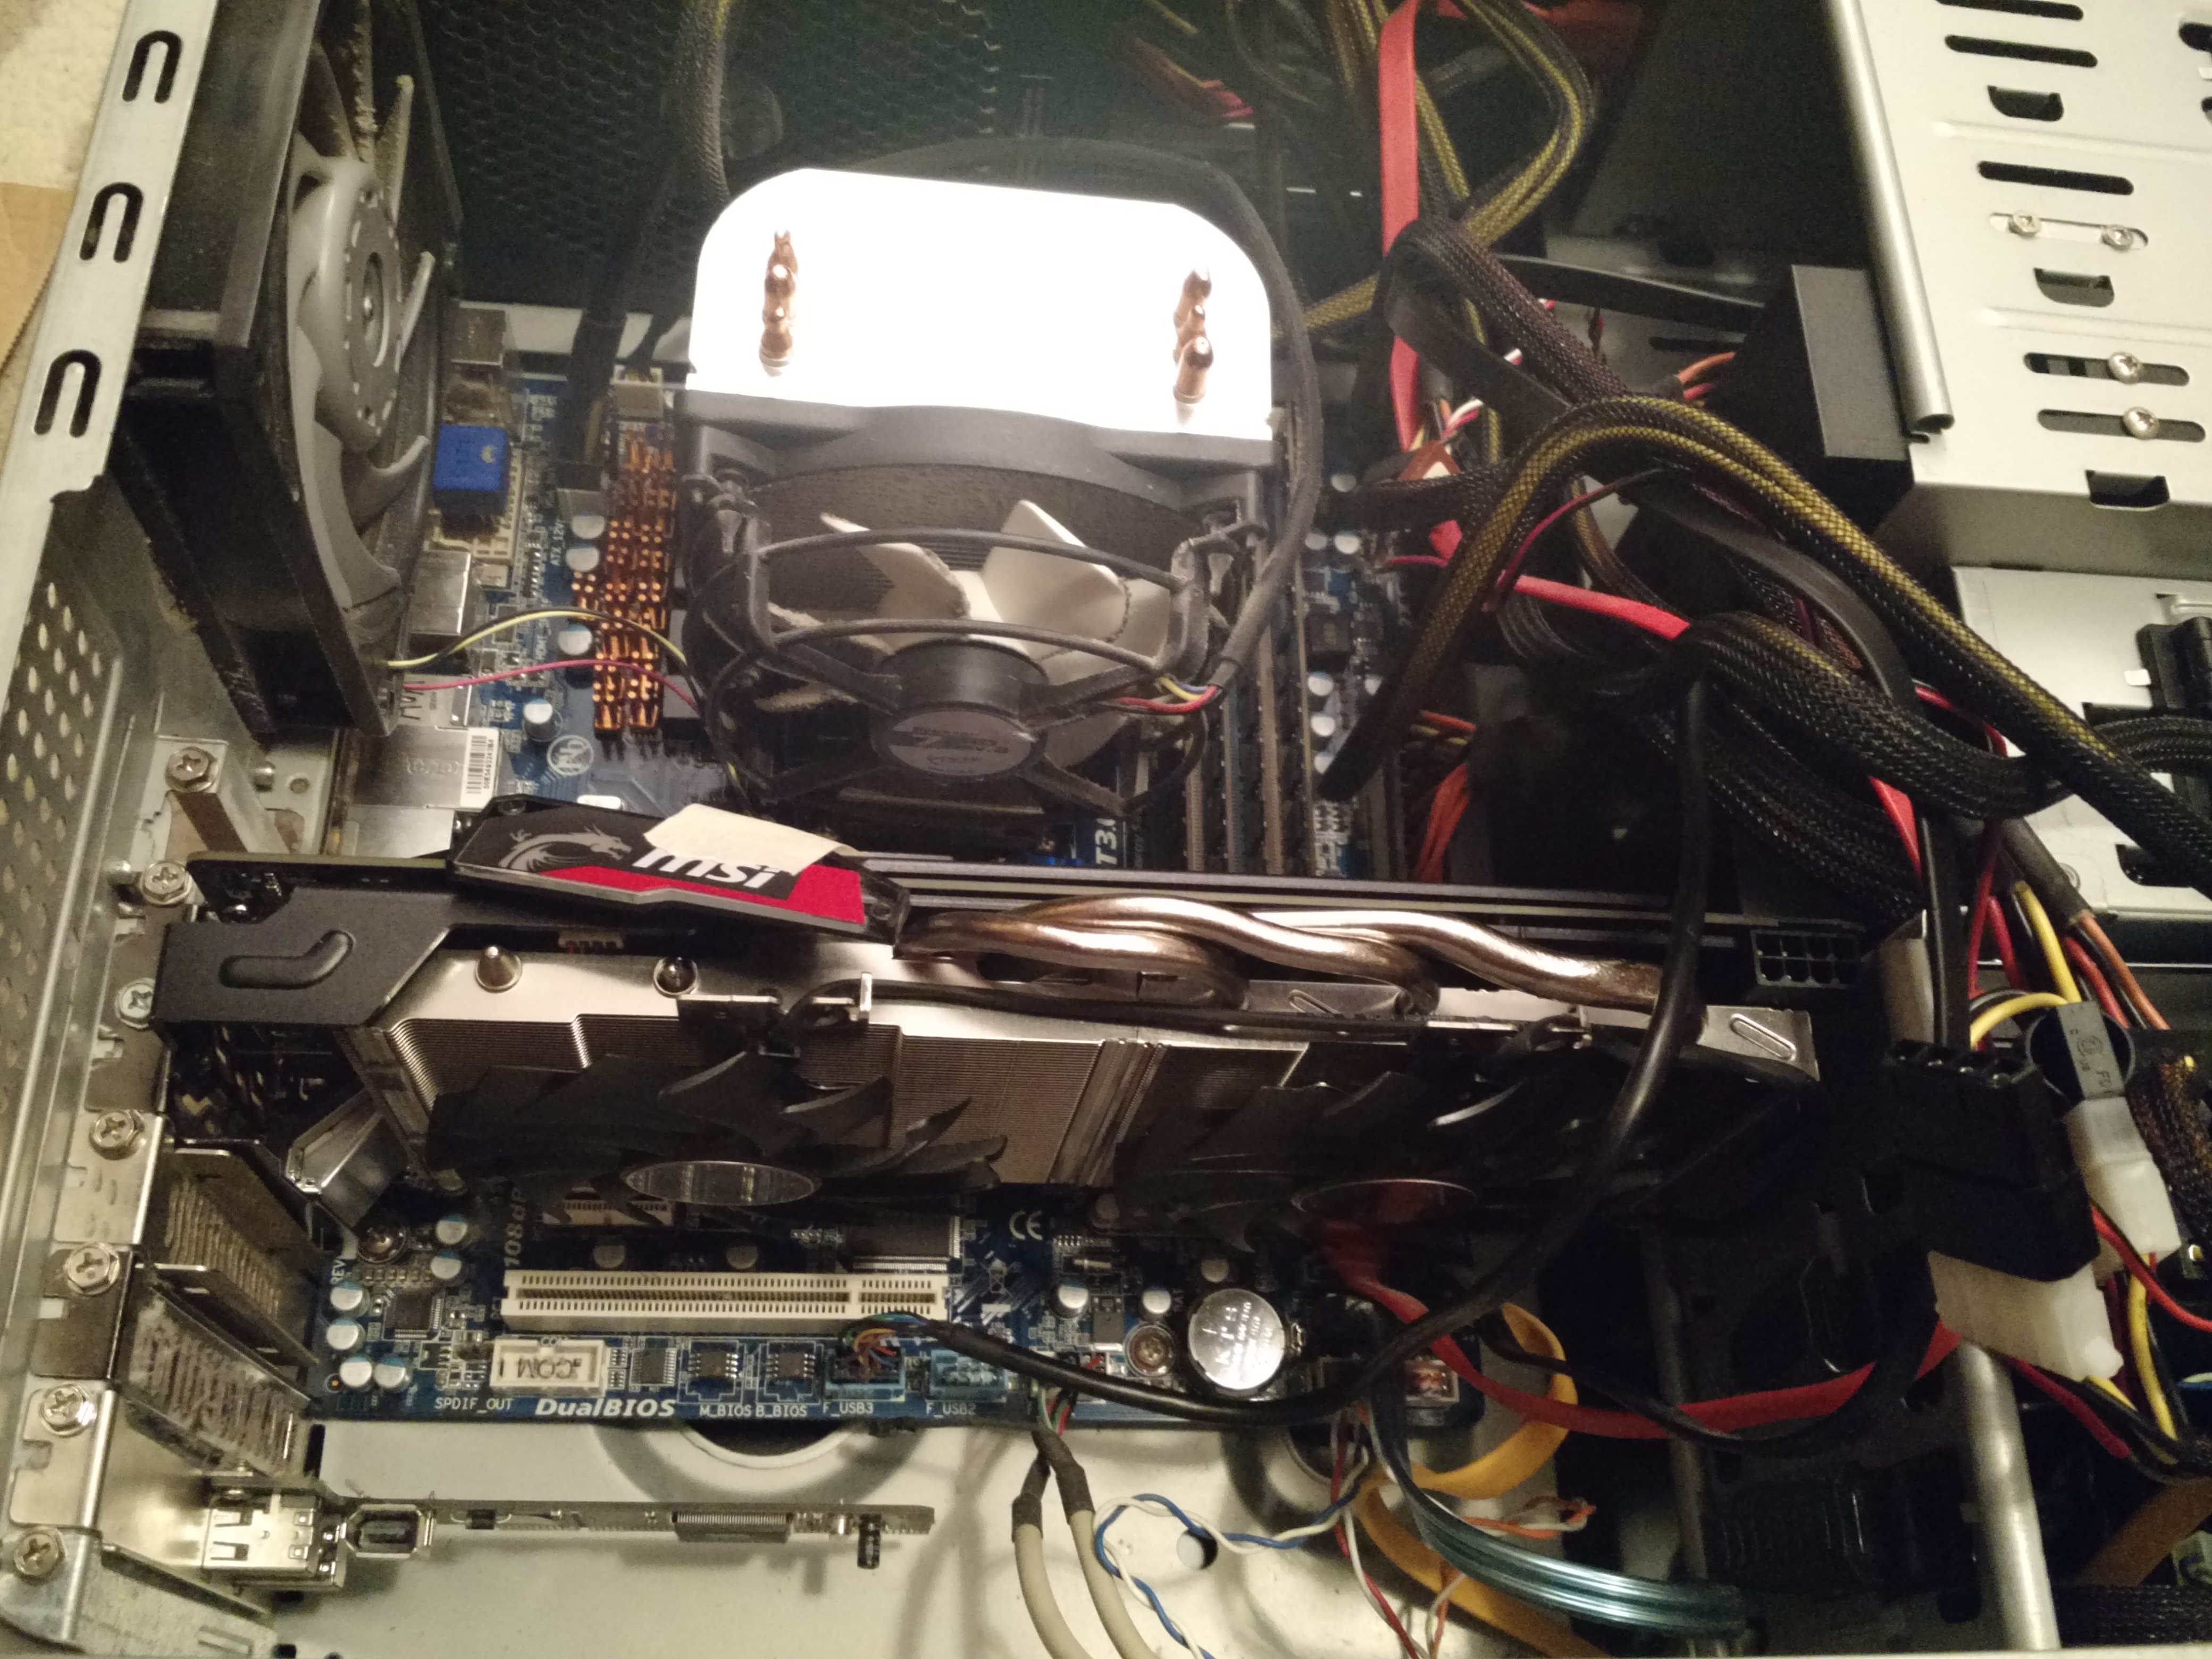
Before even downloading Folding@Home, you should do a few basic things just to make sure the system is going to be stable for heavy computations. On the software side, this means updating drivers, making sure virus definitions and Windows updates are up to date, etc. On the hardware side, I recommend fully air-canning the dust out of your machine to optimize cooling. If the computer is older and the GPU you plan to use has been installed for a while, it’s worth taking the graphics card out and hitting it with some compressed air from all angles to clean out the heat sinks.
Step 2: Download and Install V7 Client
The Folding@Home V7 client can be found here:
The current client version is 7.5.1. Go ahead and install it. For this part, it’s basically just following the prompts. F@H’s default Windows install guide works well enough, and you can read that here. All of this can be configured later within the client (and this will be required for GPU folding). So, I’m linking to the standard install guide instead of regurgitating the steps, because I’m lazy I want this to be done identically to how Stanford * the F@H Consortium recommends it be done. If you don’t want to fold anonymously, select the “Set up an identity” button. You’ll want to pick a user name and enter a team number if you have one you’d like to join.
For example, if you wanted to join our team, you’d enter number 54345 in the team number field to join team Nuclear Wessels!
A note about Passkeys: you want one of these if you want to get lots of points and compete on the F@H leaderboards. Passkeys are a secure key that makes sure your points are your own (i.e. no one is using your username to generate points elsewhere). You need to have a Passkey if you want to be eligible for the Quick Return Bonus (more points given to users who do science quickly). You become eligible for the bonus once you have successfully completed ten work units and you have a valid passkey. You can get a Passkey here (but you don’t have to do this right away. Just like configuring your GPUs, it can be done later).
Step 3: Configure the Client for GPU Folding

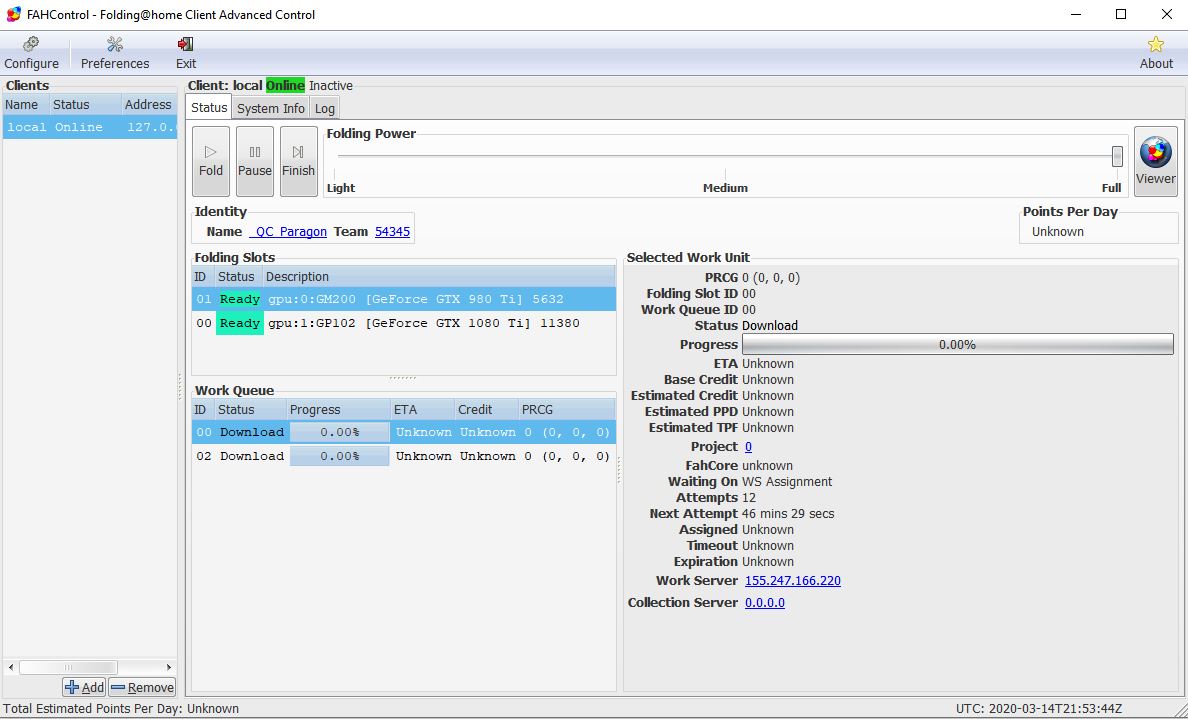
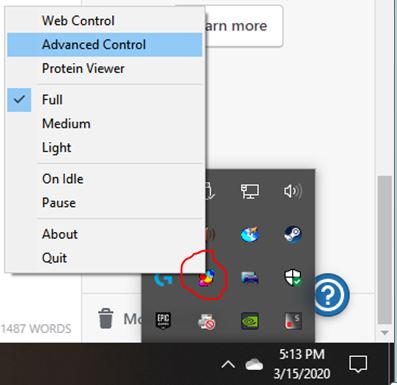
Now we are going to edit settings within the Advanced Control section of the Folding@Home client. To get here, look at your Windows task bar (next to the clock). Once F@H is installed, there should be a little molecule there. Right-click that bad boy and select “Advanced Control” to open the local client window.
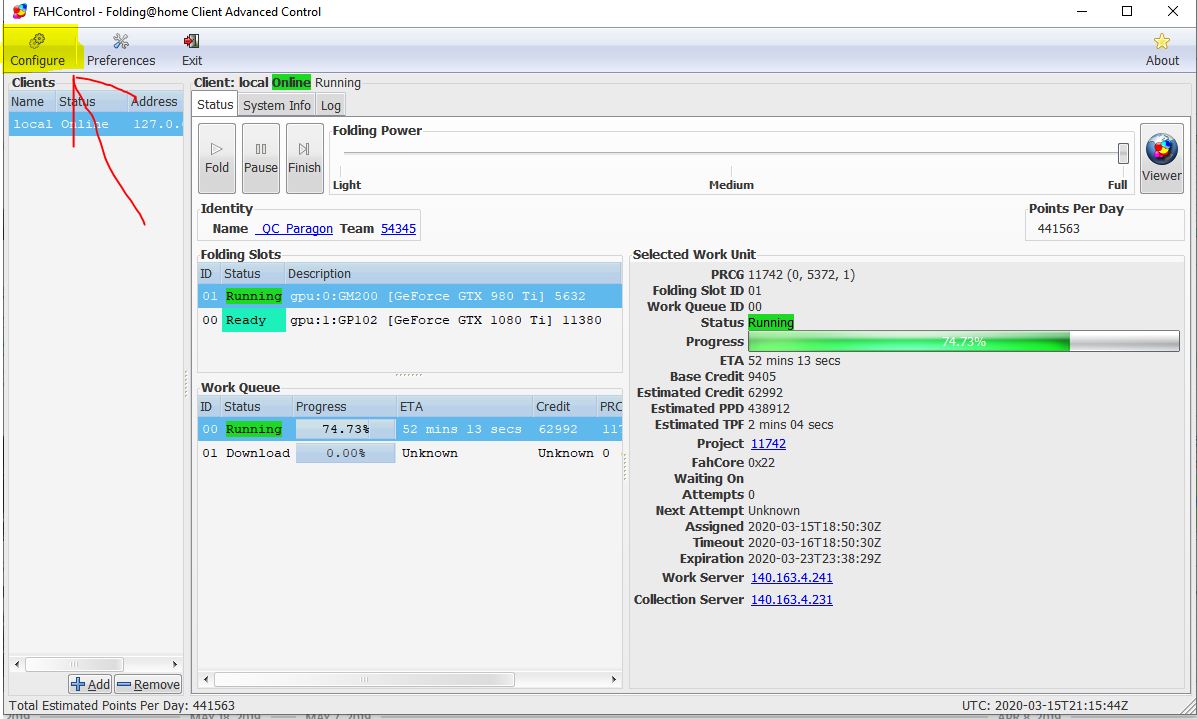
This opens up the client view. Here is what mine currently looks like (with GPU slots configured). Depending on how you got here, you might or might not have a team name and user identity displayed, and you might or might not have CPU folding enabled.

Go ahead and click the “Configure” button in the top-left of the window. Go to the “Identity” tab first.
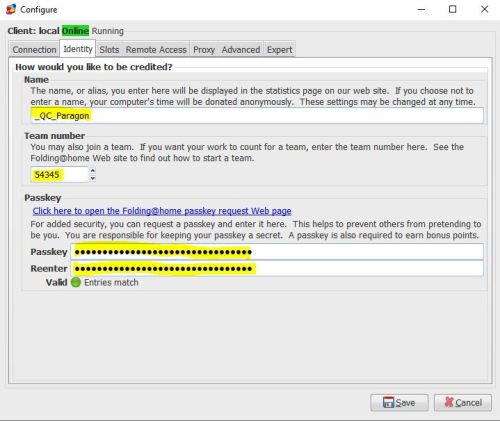
Here, you can change any of the user info and team name info you entered when you installed the V7 client. You can also enter a Passkey if you have one (for those sweet, sweet Quick Return Bonus Points!).
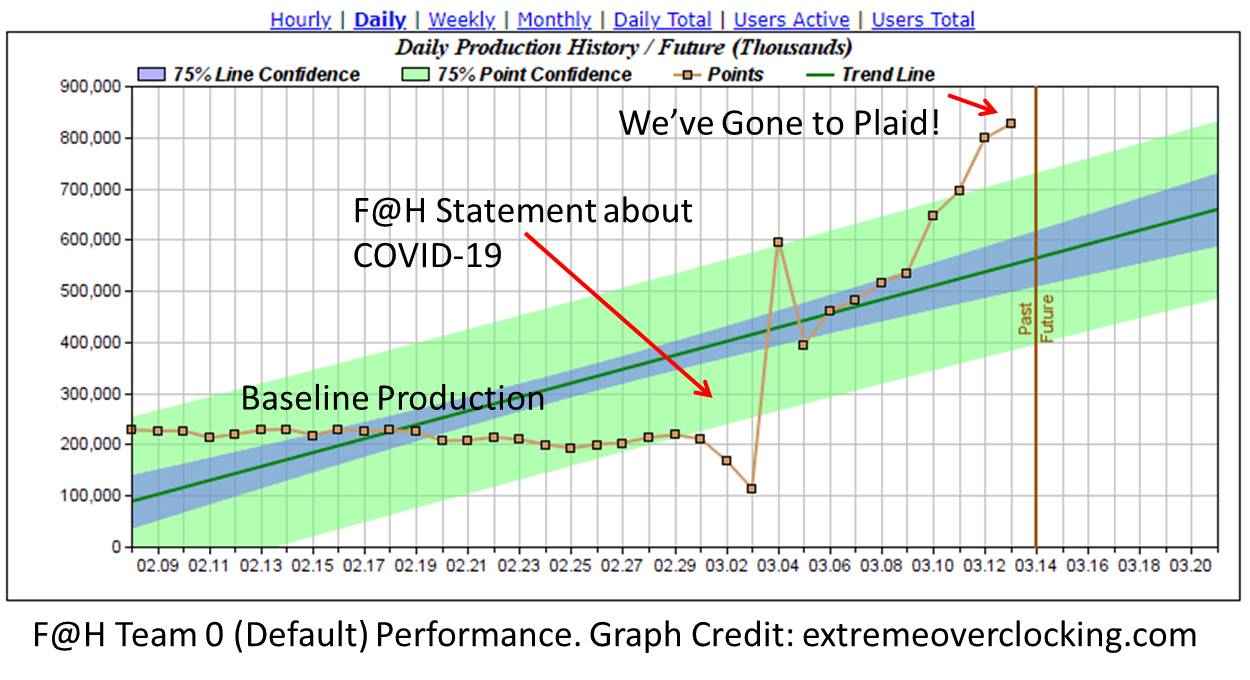
Pitch: I’d be honored if you joined team # 54345 (Nuclear Wessels). We are currently doing everything we can to fight the COVID-19 coronavirus.

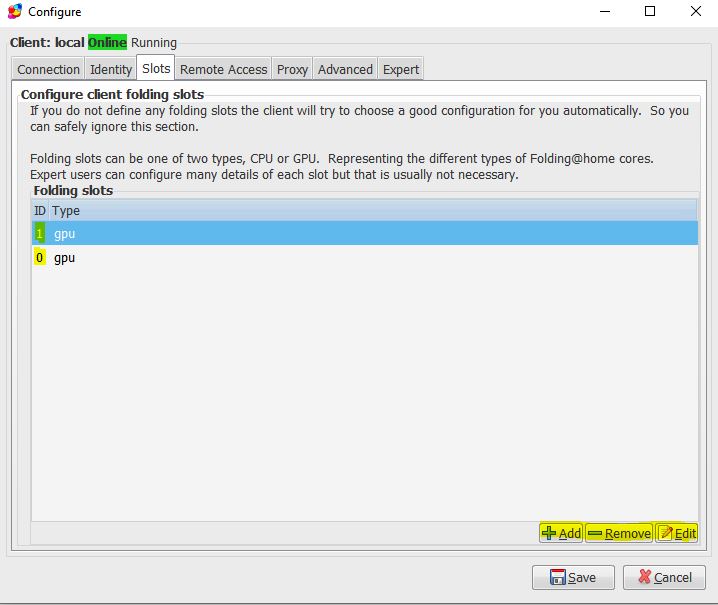
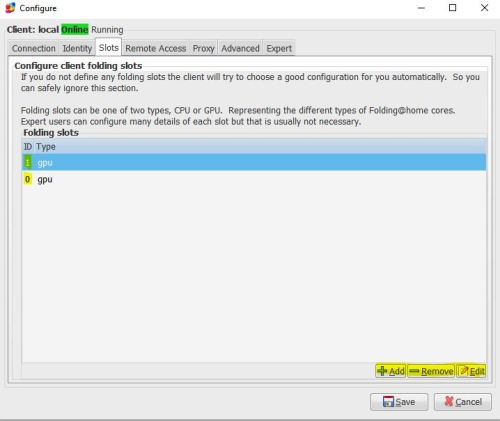
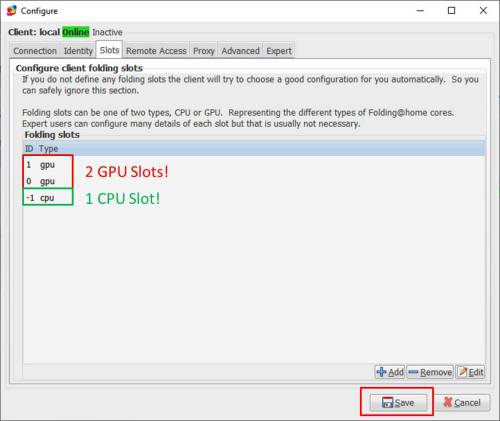
Next, go one tab over to “Slots”. Here, you can see what devices Folding@Home plans to use (either CPU or GPU). For my setup, I have removed all CPU slots and added two GPU slots (one slot for my 980 Ti and one for my 1080 Ti). If you originally started folding on the CPU and want to switch to GPU folding, you can delete your CPU slot here and add GPU slot(s) for your graphics card(s).
Note: If you want to do mixed hardware folding (CPU + GPU), I will talk about that in Step 4.
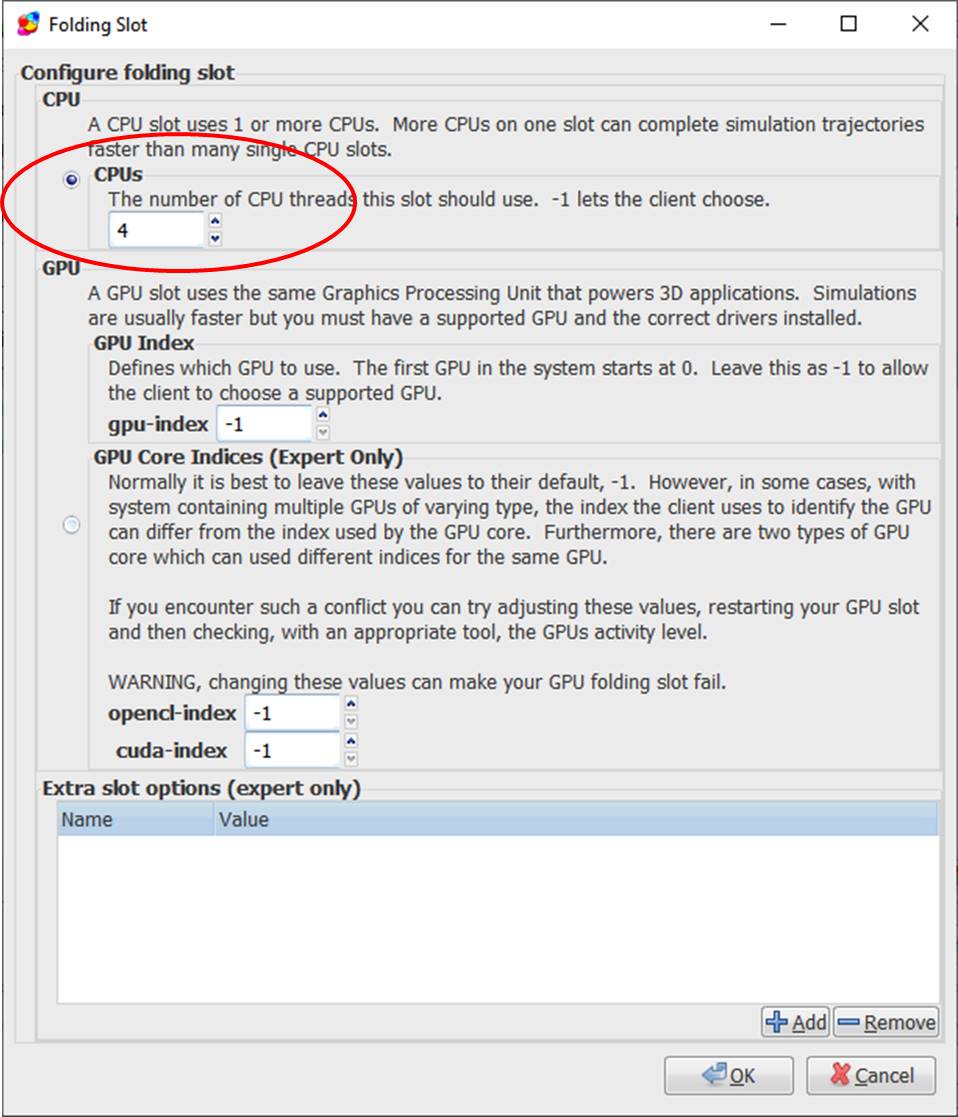
The slot configuration window opens up when you add or edit a slot. Here are the options.
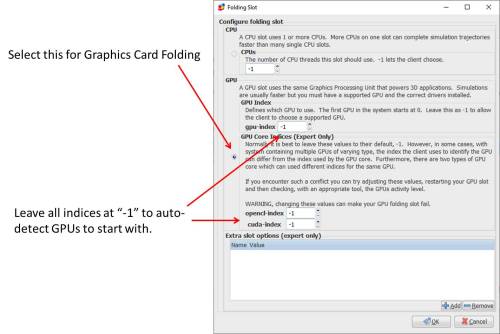 Selecting the GPU button and leaving all the index settings at -1 is a good place to start. Nine times out of ten, the client will properly detect graphics cards this way. For my computer, adding two GPU slots with settings like this resulted in it properly detecting and folding on my installed GTX 980 Ti and GTX 1080 Ti cards.
In rare cases, the client might get confused. This happens in systems with onboard graphics (such as with AMD APUs). What happens is you are trying to fold on your discrete graphics card, and instead the F@H client is running the GPU slot on the APU. When this happens, I’ve found the easiest thing to do is reboot the computer, go into the BIOS, and disable the APU graphics from there, so that the client can’t even see the APU. Thus, the GPU slot with a -1 index defaults to the discrete graphics card.
Alternatively, you can use the gpu-index, opencl-index, and cuda-index boxes to try and get the slot to run on the correct graphics card. This is a trial and error process that is beyond the scope of this guide (leave me a comment if you need help with this, or ask someone in the Folding@Home Forums).
Advanced Slot Options
The Extra Slot Options (expert only) box on the bottom can sometimes help you eek a bit more performance out of the GPU slots. However, your mileage may vary. You can add or remove slot options with the + and – buttons on the bottom-right.
The settings I tend to add are these:
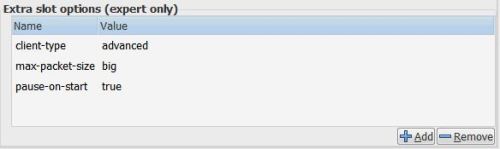
Here, client-type advanced lets me get “late stage beta” work units, which might be a bit more unstable than normal work units, yet this helps the Folding@Home Consortium get new projects tested sooner. Max-Packet-Size Big (other options are “normal” and “small”) lets me download large molecules that will push the system a bit harder (more VRAM needed, more internet bandwidth, etc). Pause-on-start (value of “true” or “false”) tells the system to pause the folding slot when the computer boots (instead of automatically folding as soon as the machine is on). This is nice for when I want to kick folding off manually. Set this to “false” or leave it blank if you want the computer to fold automatically after a restart.
For a detailed list of these slot options, see the config guide here. Note: some of this is out of date.
Step 4 (Optional): Configure a CPU Slot as well
If you have CPU cores to spare, you can add a CPU folding slot in addition to the GPU slots. I recommend leaving 1 CPU core free for Windows background tasks (unless you are making a dedicated folding rig and don’t mind it being a bit slow to use). You should also keep 1 CPU core free for feeding each GPU that you have in your system. So, for my 8-core AMD FX-8320e with my two graphics cards, I could do something like this:
Total CPU Cores: 8
Cores needed for Windows: 1
Cores Needed for GPU Slots: 2 (one for each GPU)
Cores Remaining: = 8-1-2 = 5
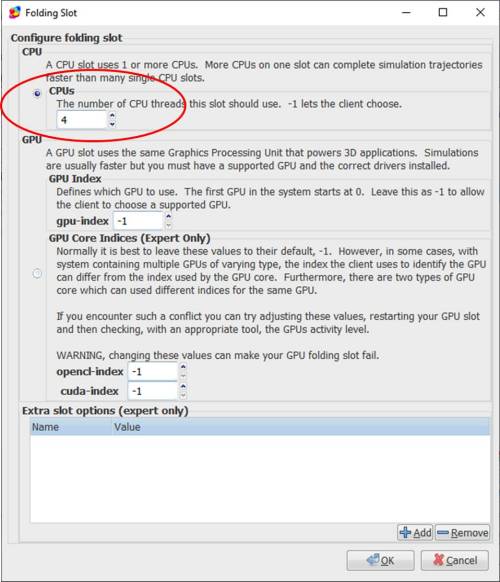
So, theoretically, I can set my CPU folding slot to use 5 CPU cores. Now, an interesting fact is that in multi-core computing, prime numbers like 3, 5, and 7 do not work so well. Folding at home also doesn’t do well with high prime numbers, or multiples thereof (such as 14 threads, which is a multiple of prime number 7). It has to do with how all the data threads are stitched together.
For example, you get similar performance folding with 4 CPU cores as with 5 (4 is a nice base 2 number that computers like). In my case, for a non-dedicated folding rig, I set up a CPU slot with 4 CPU cores enabled, leaving two cores to handle whatever else the computer is doing and 2 cores to feed the graphics cards. Incidentally, if this were a guide about just setting up CPU folding, I would leave this box at “-1”.
Now, just hit the OK button and then save the slot configuration.
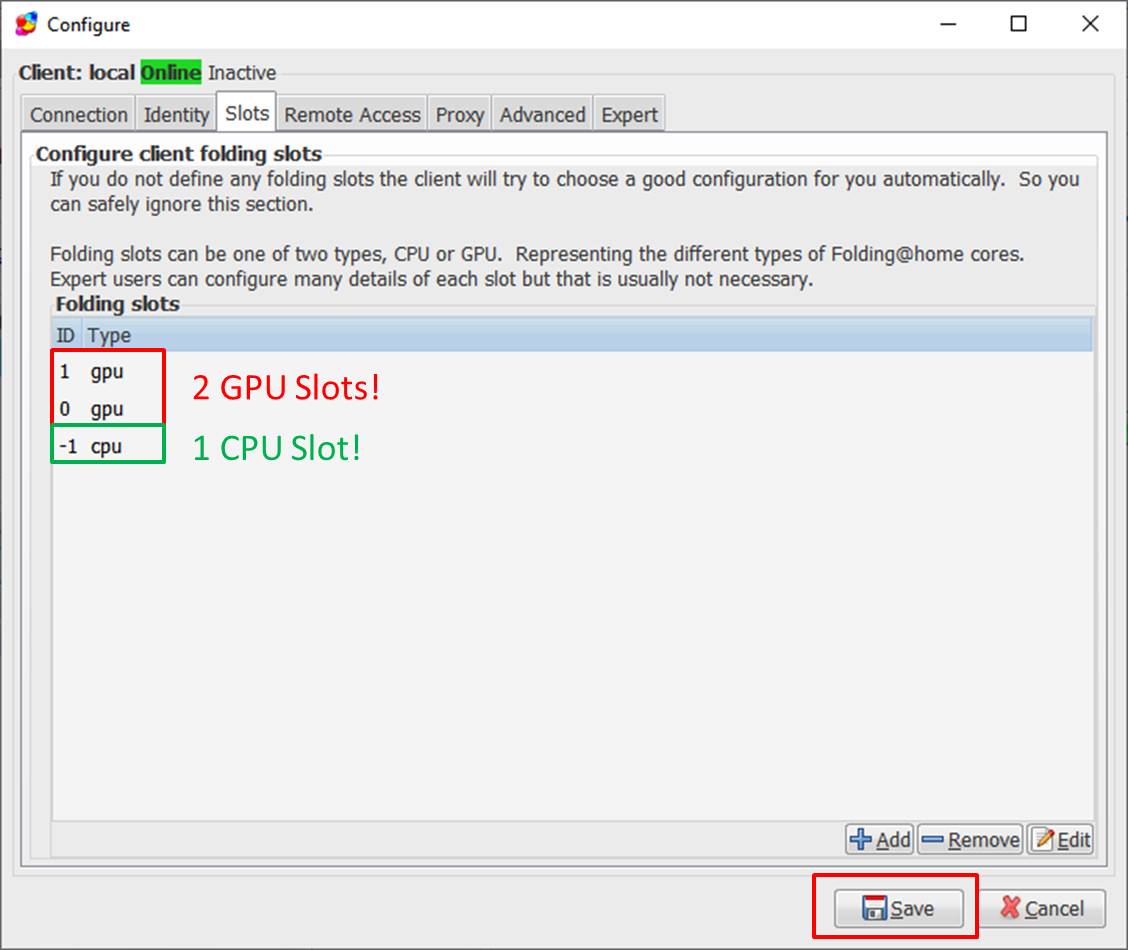
Step 5: Observe Slots Descriptions in the Client
Now, I can see that I have three slots (two GPU and one CPU) listed in the client window.
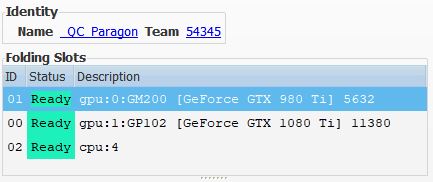
Here, you should see that the CPU slot is using the number of threads you told it to use (4, in my case), and that the graphics cards are correctly identified. This all looks good.
Step 5: Watch it run!
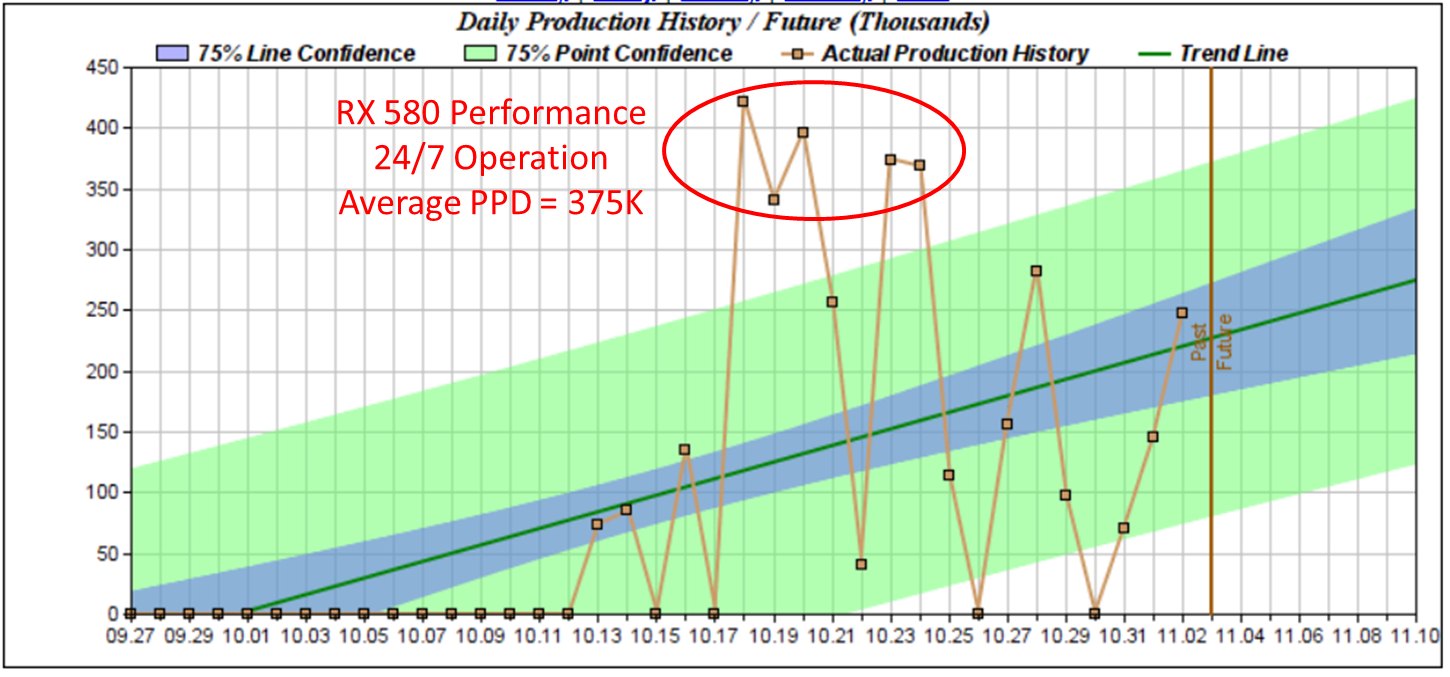
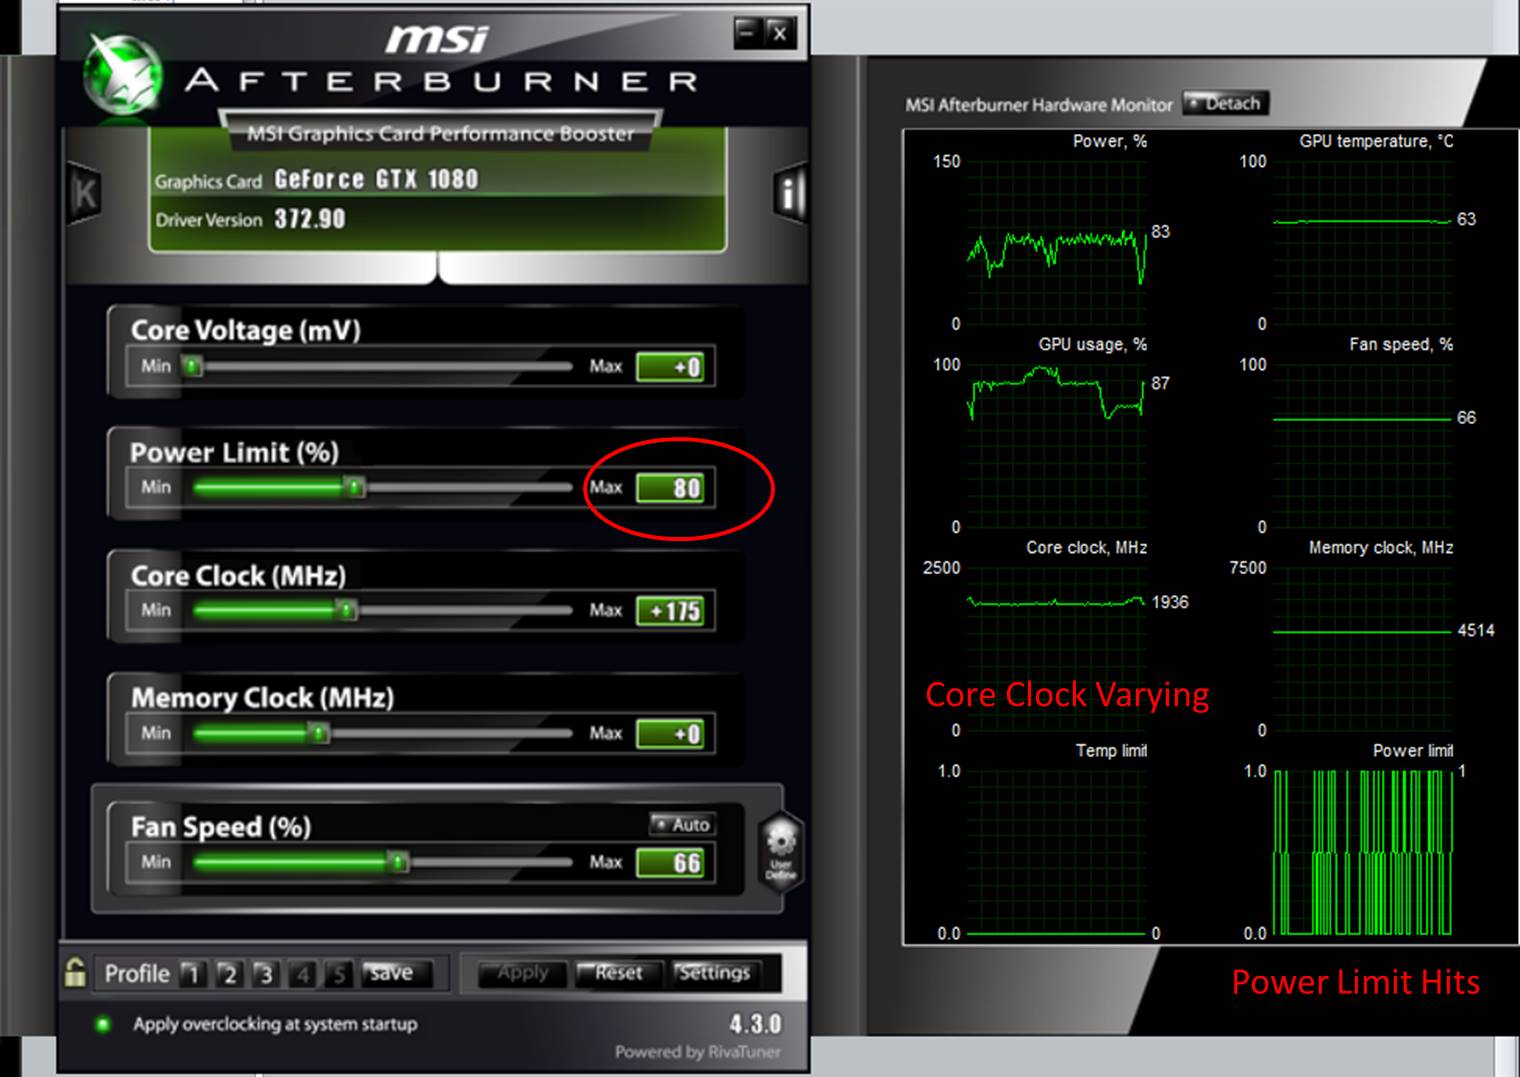
Once you have your slots configured, you should be able to sit back and watch your computer fight disease with everything it’s got. One last thing: A helpful tool for graphics card monitoring is something like MSI Afterburner, or AMD’s built-in tool Wattman. It’s good to use these to make sure your card has enough thermal headroom to perform (keep it under 80 degrees C if you can!). If your card is thermally throttling, you’ll see an impact to folding@home PPD. I find that setting custom fan curves, or just setting the fan to run a bit faster than it normally would, is often enough to eliminate this.
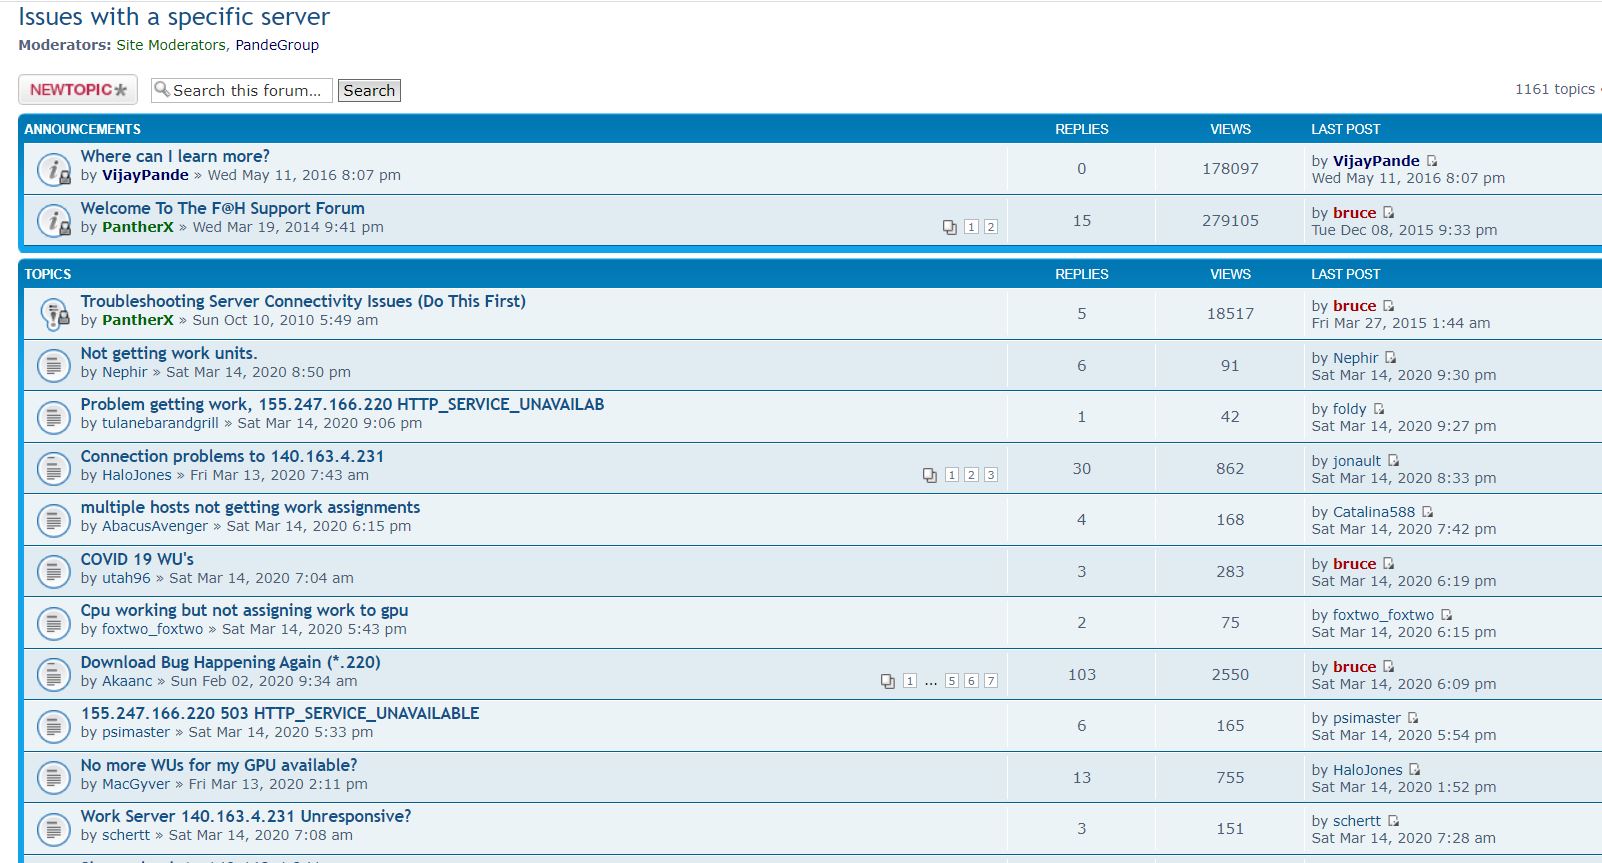
Troubleshooting
The V7 client installer does the best job at detecting your specific graphics hardware during initial software installation. If you added a new graphics card that is not recognized, you should do a clean re-install of the V7 client. Write down your Name, Team Number, and Passkey, uninstall the client completely (including data), reinstall, and see if the new card is detected.
Some new graphics cards are also not immediately supported upon release. For example, the Radeon 5700 XT is only recently gaining support with advanced beta work units, but work is progressing to get this card fully supported (as of 3/2020). You can read up on which cards are supported and which aren’t yet on the GPU Whitelist Thread.
Leave me a comment if…
Did this guide help you? Did I miss something? Let me know how I can help and make this better by leaving a comment. Thanks!
-Chris
Addendum: Helpful Links to Other Tutorials
HFM.net – A remote monitoring program for F@H Clients
HFM.net monitoring tutorial (Youtube) – Video Tutorial by Frax1006
Teamviewer Guide – A remote desktop solution to let you log into folding machines and monitor / configure them. This is an excellent write-up by Pyroball.
Official F@H Advanced User Custom Installation Guide
Official F@H Configuration Guide
Overclocker’s Club F@H Guide