Tag Archives: Folding Efficiency

AMD Ryzen 9 3950X Folding@Home Review: Part 3: SMT (Hyperthreading)

Hi all. In my last post, I showed that the AMD Ryzen 9 3950x is quite a good processor for fighting diseases like Cancer, Alzheimer’s, and COVID-19. Folding@Home, the distributed computing project helping researchers understand various diseases, definitely makes good use of the 16 cores / 32 threads on the 3950x.

In this article, I’m taking a look at how virtualized CPU cores (Simultaneous Multithreading in AMD speak or Hyperthreading for you Intel fans) helps computational performance and efficiency when running Folding@Home on a high-end CPU such as the Ryzen 9 3950x.

Instead of regurgitating all of the previous information, here are some links to bring you up to speed if you haven’t read the previous posts.

Socket AM4 Benchmark Machine

AMD Ryzen 9 3950x Review: Part 1 (Overview)

AMD Ryzen 9 3950X Review: Part 2 (Average Results vs. # of Threads)

Test Setup

For this test, I used the same settings as in Part 2, except that I disabled SMT in the BIOS on my motherboard. Thus, Windows 10 will only see the 16 physical CPU cores, and will not be able to run two logical threads per CPU core. As before, I ran all testing using Folding@Home’s V7 client. I set the CPU slot configuration for a thread value of 1-16. At each setting, I ran five work units and averaged the results. Note that AMD’s core performance boost was turned off for all tests, so at all times the processor ran at 3.5 GHz.

Performance

As expected, as you throw more CPU cores at a problem, the computer can chew through the math faster. Thus, more science gets done in a given amount of time. In the case of Folding@Home, this performance is rated in terms of Points Per Day (PPD). The following plot shows the increase in computational performance as a function of # of threads utilized by the solver. Unlike in my previous testing on the 3950x, here an increase of 1 thread corresponds to an increase of 1 engaged CPU core, since virtual threads (SMT / Hyperthreading) are disabled.

The plot below includes the individual samples at each data point as light gray dots, as well as a + / – 2 sigma (95%) confidence interval. This means that 95% of the results for a given thread setting are statistically predicted to fall within the dashed lines.

AMD Ryzen 9 3950x Performance SMT Off

As a side note, certain settings of thread count actually result in the exact same performance, because the Folding@Home client is internally using a different number than the specified value. For example, setting the CPU slot to 5 threads will still result in a 4-thread solve, because the solver is avoiding the numerical issues that occur when trying to stitch the solution together with 5 threads (5 is a tricky prime number to work with numerically). I noted these regions on the plot. If you would like more detail about this, please read the previous part of this review (part 2).

One interesting observation is that the maximum performance occurs with 15 CPU cores enabled, not the complete 16! This is somewhat similar to what was observed in Part 2 of this review (SMT enabled), where 30 threads provided slightly more points than 32 threads. More on that in a moment…

Power Consumption

Using my P3 Kill A Watt Power Meter, I measured the power consumption of the entire computer at the wall. As expected, as you increase the number of CPUs engaged, the instantaneous power consumption goes up. The power numbers reported here are averaged by “the eyeball method”, since the actual instantaneous power goes up and down by a few watts as the computer does its thing. I’d estimate that these numbers are accurate within 5 watts.

AMD Ryzen 9 3950x Power Consumption SMT Off

Efficiency

The ultimate goal of this blog is to find the most efficient settings for computer hardware, so that we can do the most scientific research for a given amount of power consumption. Thus, this next plot is just performance (in PPD) divided by power consumption (in watts). I left off all the work unit variation and confidence interval lines, since it looks about the same as the performance plot, and it’s cleaner with just the one average line.

AMD Ryzen 9 3950x Efficiency SMT Off

As with performance, setting Folding@Home to use 15 CPUs instead of the full 16 is surprisingly the best option for efficiency. The difference is pretty profound here, as the processor used more power at 16 threads than at 15 threads while producing less points at 16 threads than at 15.

Comparison to Hyperthreaded Results

To get a better idea of what’s going on, here are the same three plots again with the average results overlaid on the previous results from when SMT was enabled. Of course the SMT results go up to 32 threads, since with virtual cores enabled, the 16-core Ryzen 9 3950x can support 32 total threads.

AMD Ryzen 9 3950x Performance SMT Off vs On

AMD Ryzen 9 3950X Performance: SMT Study

AMD Ryzen 9 3950x Power SMT Off vs On

AMD Ryzen 9 3950X Power Consumption: SMT Study

AMD Ryzen 9 3950x Efficiency SMT Off vs On

AMD Ryzen 9 3950X Efficiency: SMT Study

Conclusion

Disabling SMT (aka Hyperthreading) essentially limits the Ryzen 9 3950x to a maximum thread count of 16 (one thread per physical core). The results from 1-16 threads are very similar to those results obtained with SMT enabled. Due to work unit variation, the performance and efficiency plots show what I would say is effectively the same result with SMT on vs. off, up to 16 threads. One thing to note was that the power consumption in the 12-16 thread range did trend higher for the SMT off case, although the offset was small (about 5-10 watts). This is likely due to Windows scheduling work to a new physical core to handle the higher thread count when SMT is disabled, as opposed to virtualizing the work onto an already-running core using SMT. Ultimately, this slightly higher power consumption didn’t have a noticeable effect on the efficiency plot.

The big takeaway is that for thread counts above 16 (the physical core count), the Ryzen 9 3950x can utilize thread virtualization very well. The logical processors that Windows sees don’t work quite as well as true physical cores (hence the decrease in slope on the performance and efficiency plots above 16 CPUs). However, when the thread count is doubled, SMT still does allow the processor to eek out an extra 100K PPD (about 33% more) and run more efficiently than when it is limited to scheduling work to physical CPUs.

Pro Tip #1: Turn on Hyperthreading / SMT and run with high core counts to get the most out of Folding@Home!

The final observation worth noting is that in both cases, setting the F@H client to use the maximum available number of threads (16 for SMT off, 32 for SMT on) is not the fastest or most efficient setting. Backing the physical core count down to 15 (and, similarly, the SMT core count down to 30) results in the fastest and most efficient solver performance.

My theory is that by leaving one physical core free (one physical core = 2 threads with SMT on), the computer has enough spare capacity to run all the crap that Windows 10 does in the background. Thus, there is less competition for CPU resources, and everything just works better. The computer is also easier to use for other tasks when you don’t fully max out the CPU core count. This is also especially valuable for those people also trying to fold on a GPU while CPU folding (more on that in the next article).

Pro Tip #2: For high core count CPUs, don’t fold at 100% of your processor’s core capacity. Go right to the limit, and then back it off by a core.

Since you’re using SMT / Hyperthreading due to Pro Tip #1, this means setting the CPUs box in the client to 2 less than the maximum allowed. On my 16-core, 32-thread Ryzen 9 3950x, this means CPUs = 32 (theoretical max) – 2 (2 threads per core) = 30

CPU Slot Config

This result will be different on CPUs with different numbers of cores, so YMMV…I always recommend testing out your individual processor. For lower core count processors such as Intel’s quad core Q6600, running with the maximum number of cores offers the best performance. I previously showed this here.

Future Work

In the next article, I’m going to kick off folding on the GPU, an Nvidia GeForce 1650, which I previously tested by its lonesome here. In a CPU + GPU folding configuration, it’s important to make sure the CPU has enough resources free to “feed” the GPU, or else points will suffer.

I’ve also started re-running the thread tests with Core Performance Boost enabled. This allows the processor to scale up in frequency automatically based on the power and thermal headroom. This should significantly change the character of the SMT On and SMT Off plots, since everything up till now has been run at the stock speed of 3.5 GHz.

Support My Blog (please!)

If you are interested in measuring the power consumption of your own computer (or any device), please consider purchasing a P3 Kill A Watt Power Meter from Amazon. You’ll be surprised what a $35 investment in a watt meter can tell you about your home’s power usage, and if you make a few changes based on what you learn you will save money every year! Using this link won’t cost you anything extra, but will provide me with a small percentage of the sale to support the site hosting fees of GreenFolding@Home.

If you enjoyed this article, perhaps you are in the market for an AMD Ryzen 9 3950x or similar Ryzen processor. If so, please consider using one of the links below to buy one from Amazon. Thanks for reading!

AMD Ryzen 9 3950x Direct Link

AMD Ryzen (Amazon Search)

Advertisement

AMD Ryzen 9 3950X Folding@Home Review: Part 2: Averaging, Efficiency, and Variation

Welcome back everyone! In my last post, I used my rebuilt benchmark machine to revisit CPU folding on my AMD Ryzen 9 3950x 16-core processor. This article is a follow-on. As promised, this includes the companion power consumption and efficiency plots for thread settings of 1-32 cores. As a quick reminder, I did this test with multi-threading (SMT) on, but with Core Performance Boost disabled, so all cores are running at the base 3.5 GHz setting.

Performance

The Folding@Home distributed computing project has come a long way from its humble disease-fighting beginnings back in 2000. The purpose of this testing is to see just how well the V7 CPU client scales on a modern, high core-count processor. With all the new Folding@Home donors coming onboard to fight COVID, having some insight into how to set up the configuration for the most performance is hopefully helpful.

For this test, I simply set the # of threads the client can use to a value and ran five sequential work units. I averaged the performance (Points Per Day), but I also plot the individual work unit performance values to give you a sense of the variation. Since the Ryzen 9 3950x supports 32 threads, I essentially ran 160 tests. Since I wanted the Folding@Home Consortium to get useful data in their fight against COVID-19, I let each work unit run to completion, even though I only need them to run to about 10-20% complete to get an accurate PPD estimate from the client.

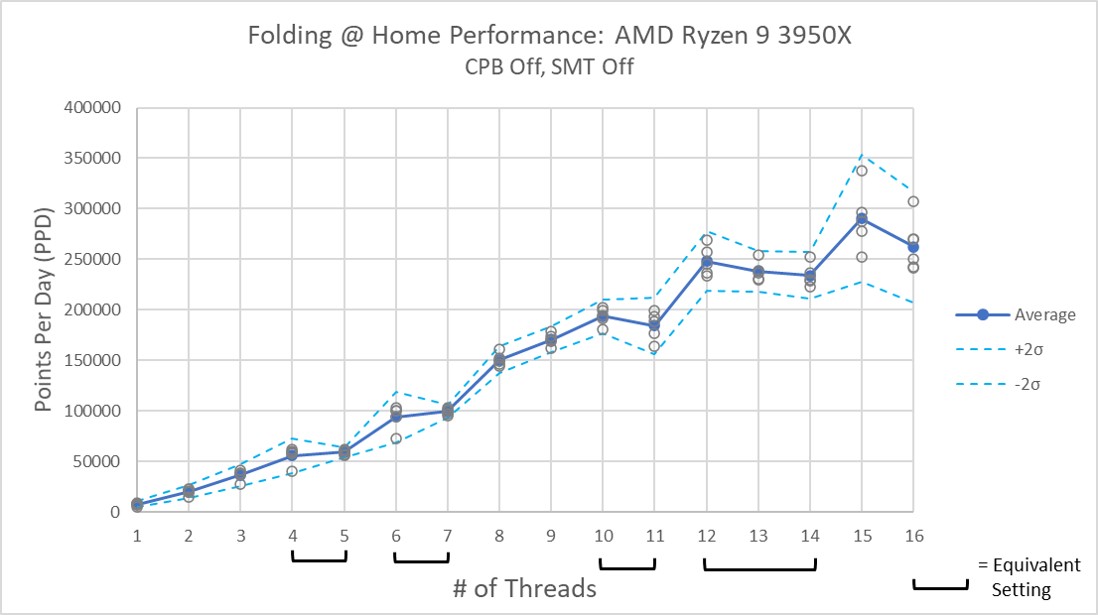
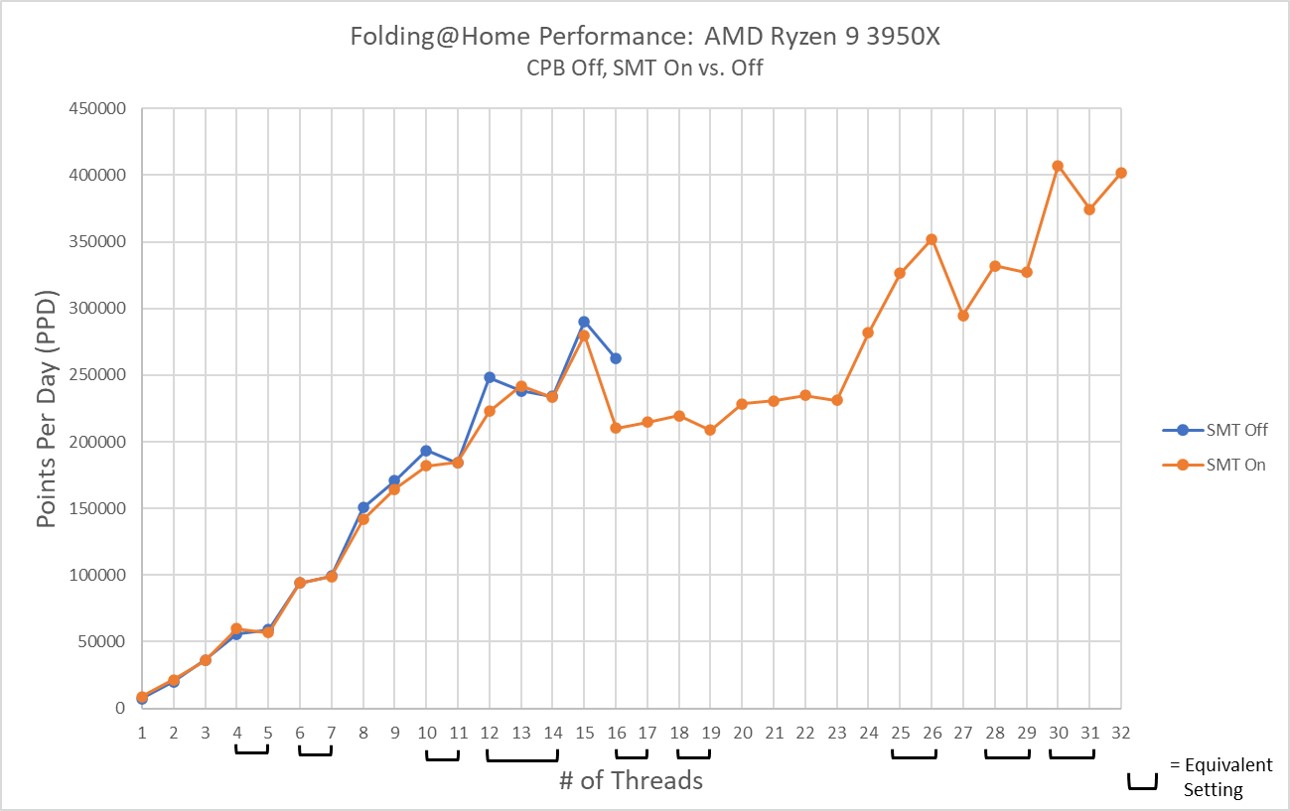
So, without further blabbing on my part, here is the graph of Folding@Home performance vs. thread count in Windows 10 on the Ryzen 9 3950x

Ryzen_3950x_Performance_SMT_Off_CPB_On

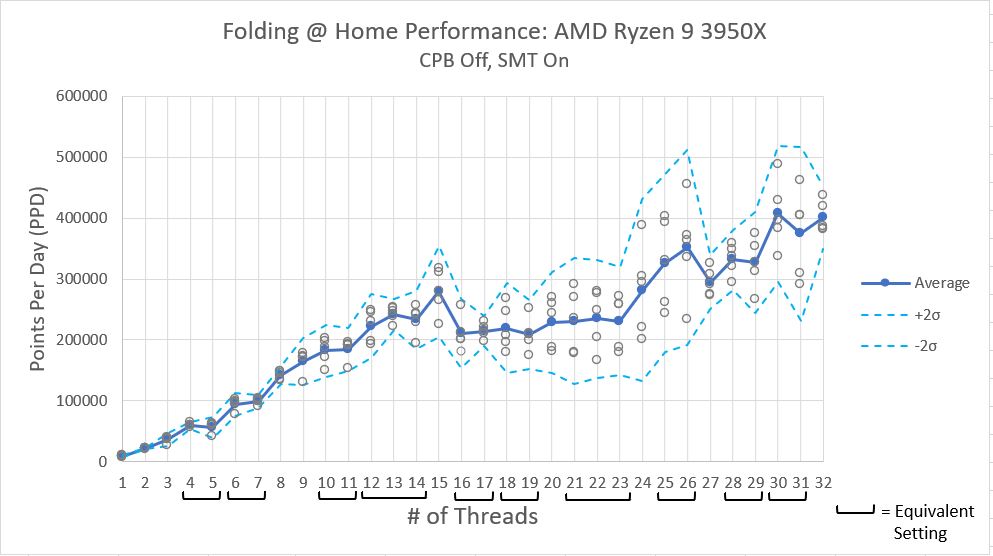
Here, the solid blue line is the averaged performance, and the gray circles are the individual tests. The dashed blue lines represent a statistical 95% confidence interval, which is computed based on the variation. The expected Points Per Day (PPD) of a work unit run on the 3950x is expected to fall within this band 95% of the time.

My first observation is, holy crap! This is a fast processor. Some work units at high thread counts get really close to 500K PPD, which for me has only been achievable by GPU folding up to this point.

My second observation is that there is a lot of variation between different work units. This makes sense, because some work units have much larger molecules to solve than others. In my testing, I found the average variation of all 160 tests to be 12.78%, with individual variance up to 25%.

My third observation is that there seems to be two different regions on this plot. For the first half, the thread count setting is less than the number of physical cores on the chip, and the results are fairly linear. For the second half, the thread count setting is higher than the number of physical cores on the chip (thus forcing the CPU to virtualize those cores using SMT). Performance seems to fall off when the CPU cores become fully saturated (threads = 16), and it takes a while to climb out of the hole (threads = 24 starts showing some more gains).

As a side note, the client does not actually run all of these thread count settings, since some prime numbers, especially large primes (7, 11) and multiples thereof cause numerical issues. For example, when you try to run a 7-thread solve, the client automatically backs the thread count down to 6. You can see warnings in the log file about this when it happens.

Prime Number Thread Adjust

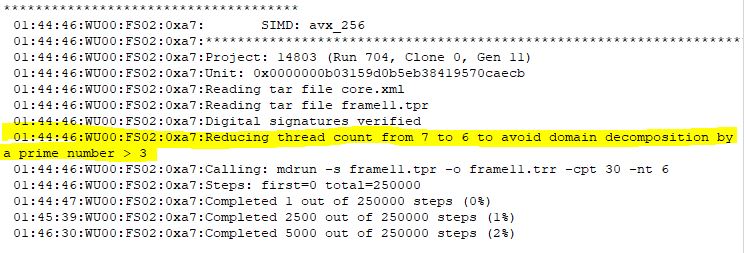
I noted all the relevant thread counts where this happens on the x-axis of the plot. Theoretically, these should be equivalent settings. The fact that the average performance varies a bit between them is just due to work unit variation (I’d have to run hundreds of averages to cancel all the variation out).

Finally, I noticed that the highest PPD actually occurred with a thread count of 30 (PPD = 407200) vs a thread count of 32 (PPD = 401485). This is a small but interesting difference, and is within the range of statistical variation. Thus I would say that setting the thread count to 30 vs 32 provides the same performance, while leaving two CPU threads free for other tasks (such as GPU folding…more on that later!).

Power Consumption

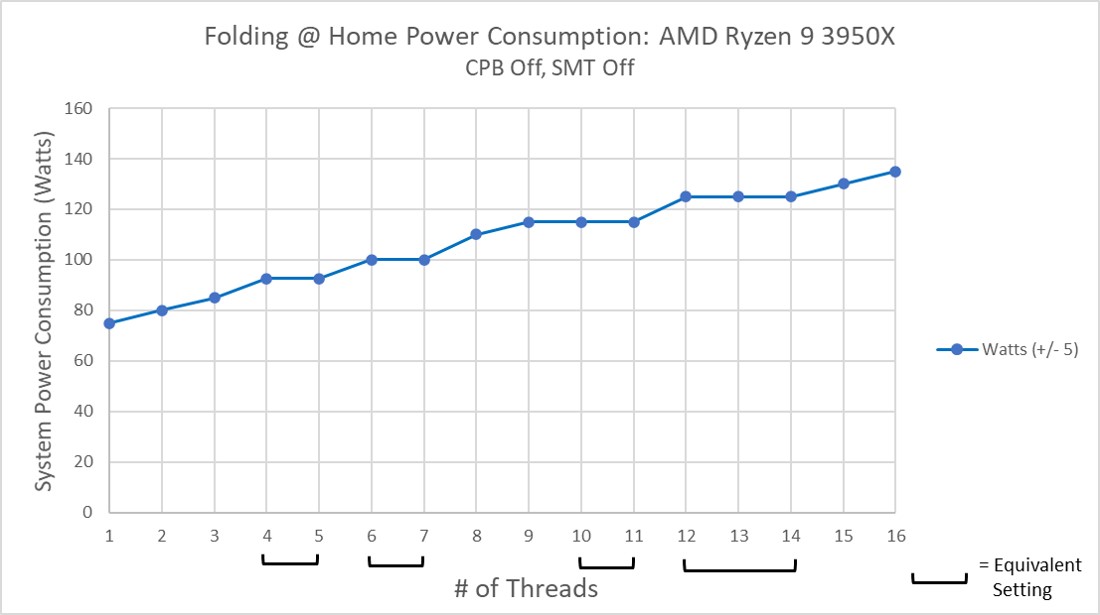
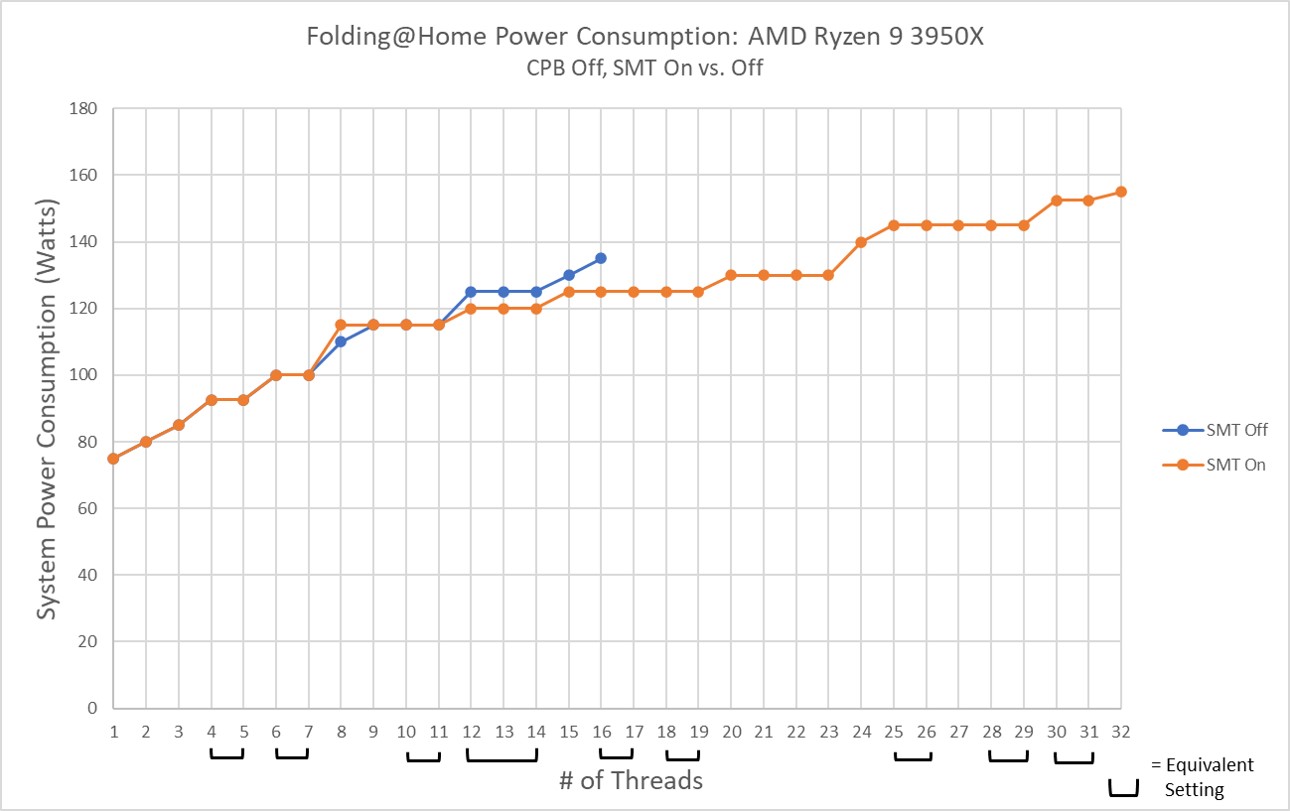
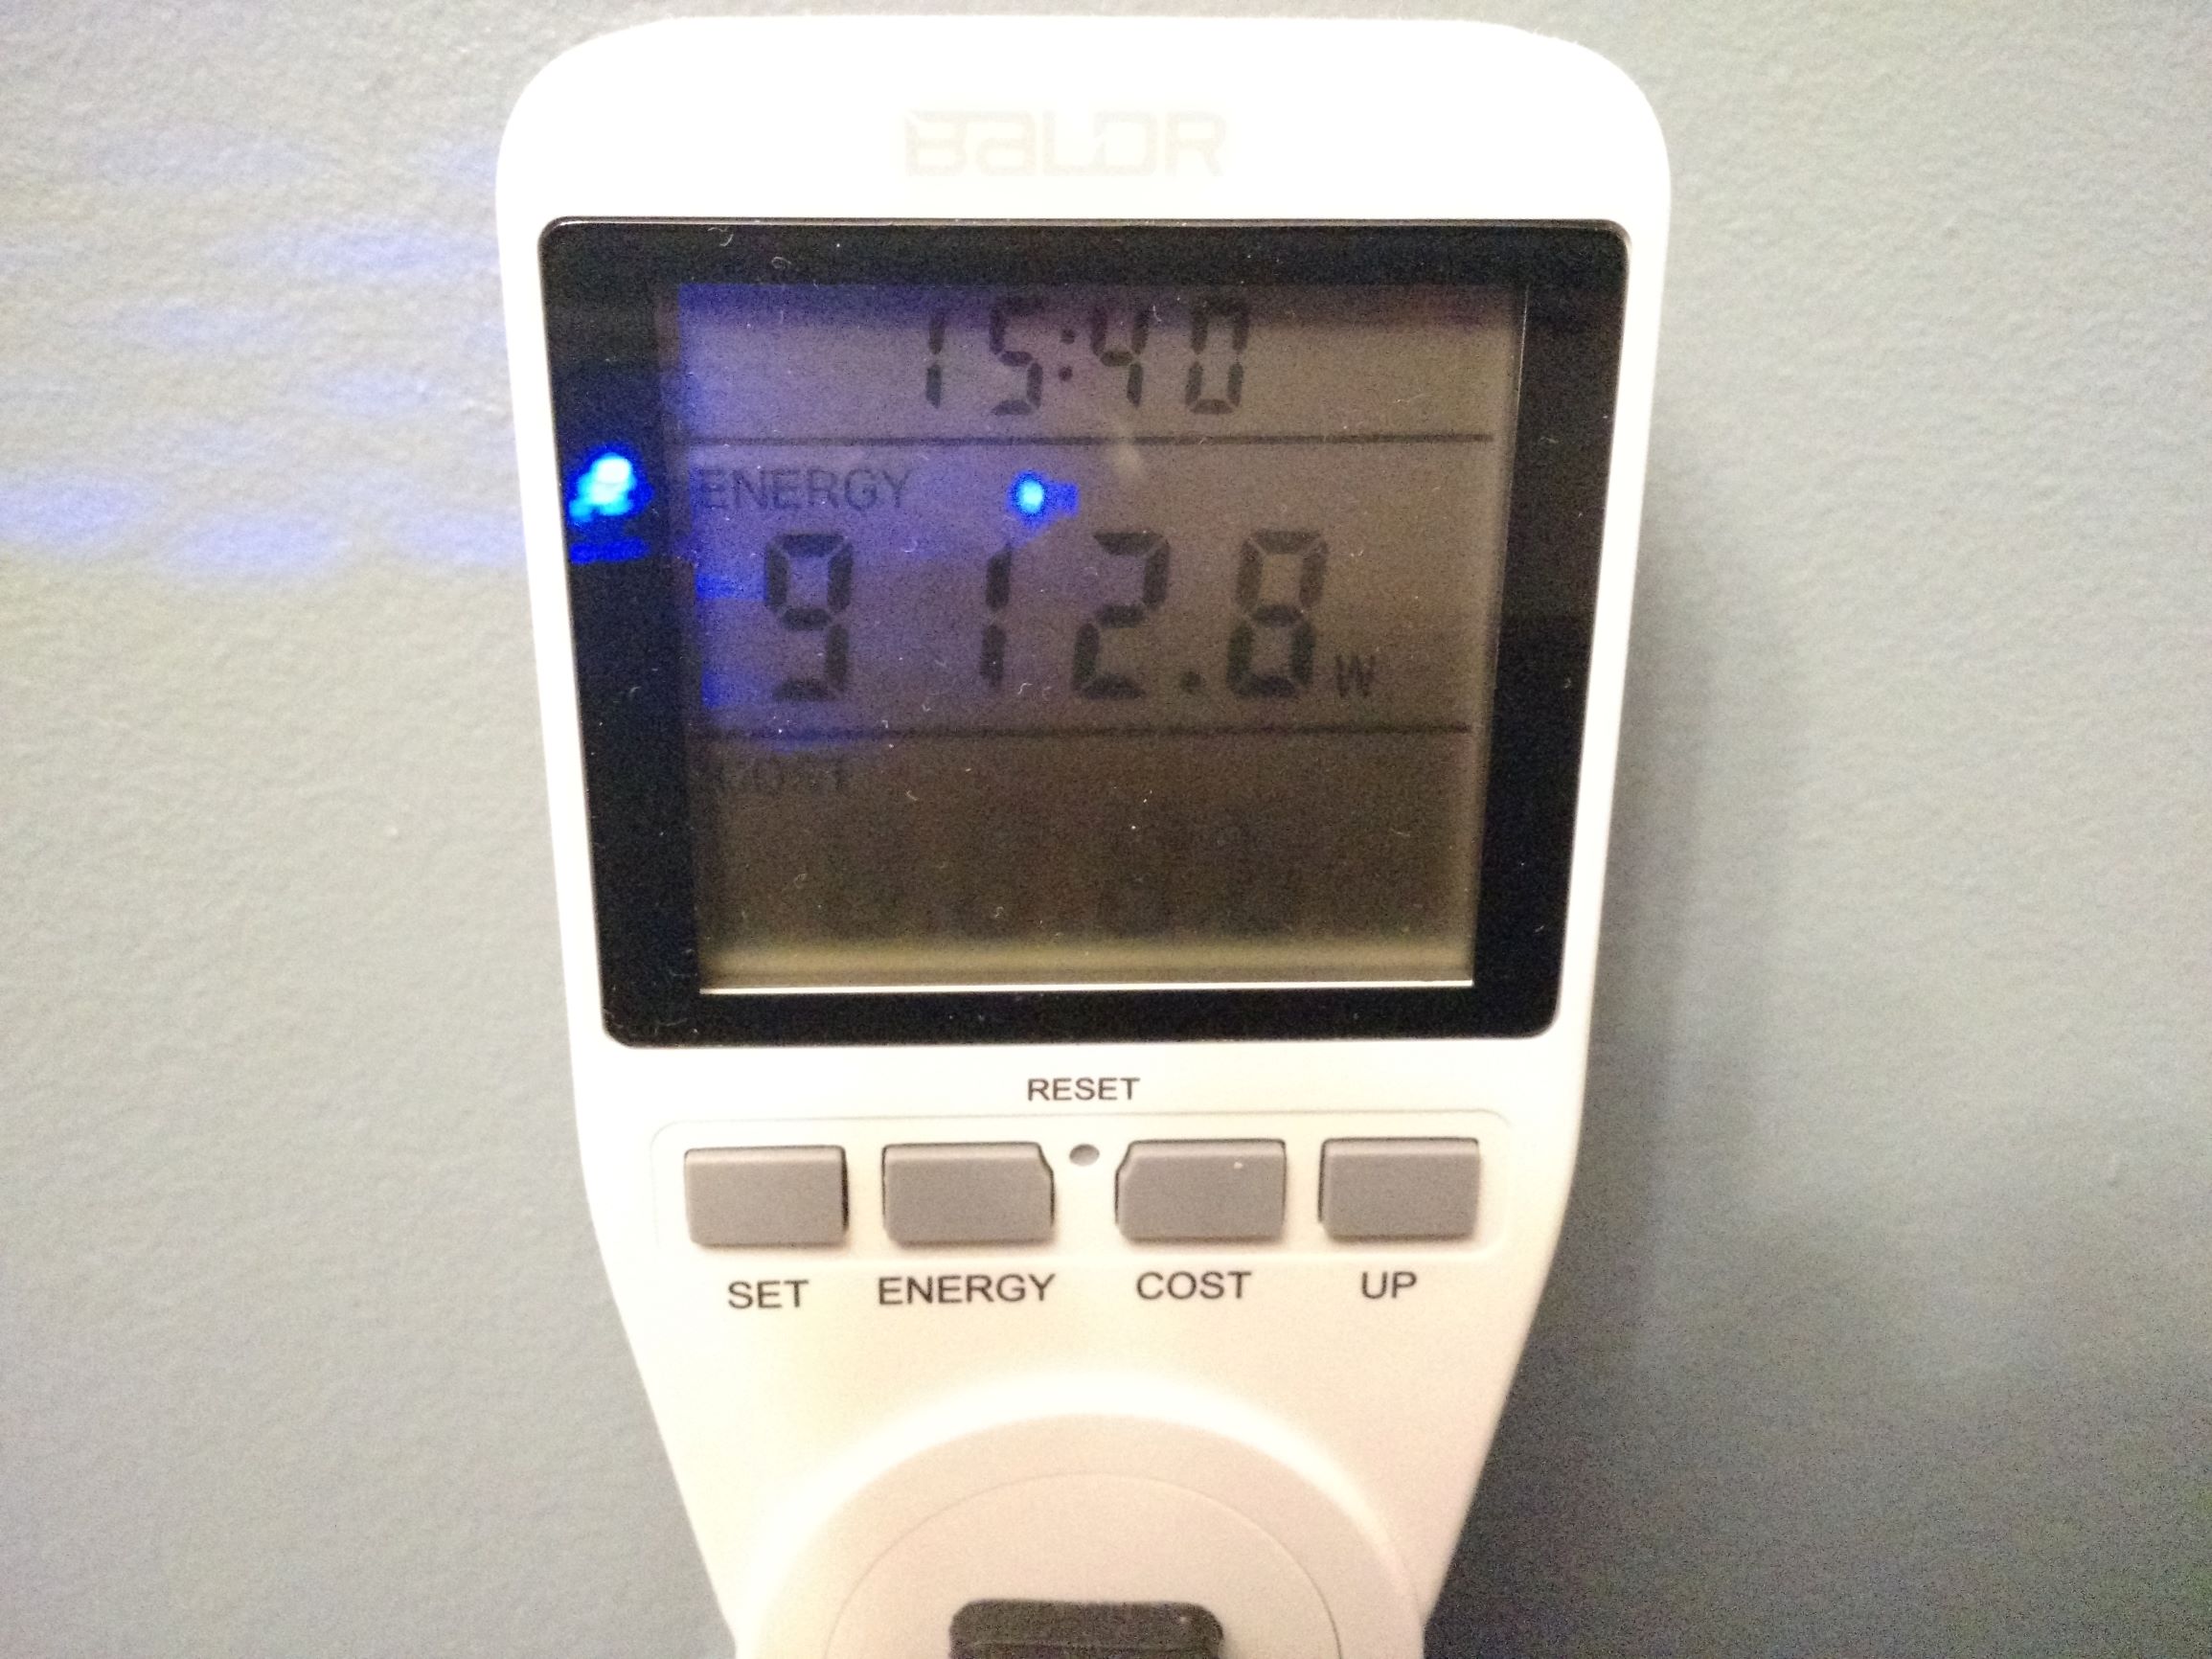
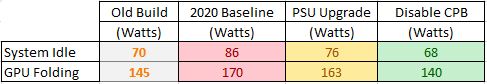
Power consumption numbers for each thread setting were taken at the wall, using my P3 Kill A Watt meter. Since the power numbers tend to walk around a bit as the computer works, it’s hard to get an instantaneous reading. Thus these are “eyeball averaged”. There was enough change at each CPU thread setting to clearly see a difference (not counting those thread settings that are actually equivalent to an adjacent setting).

Ryzen_3950x_Power_SMT_Off_CPB_On

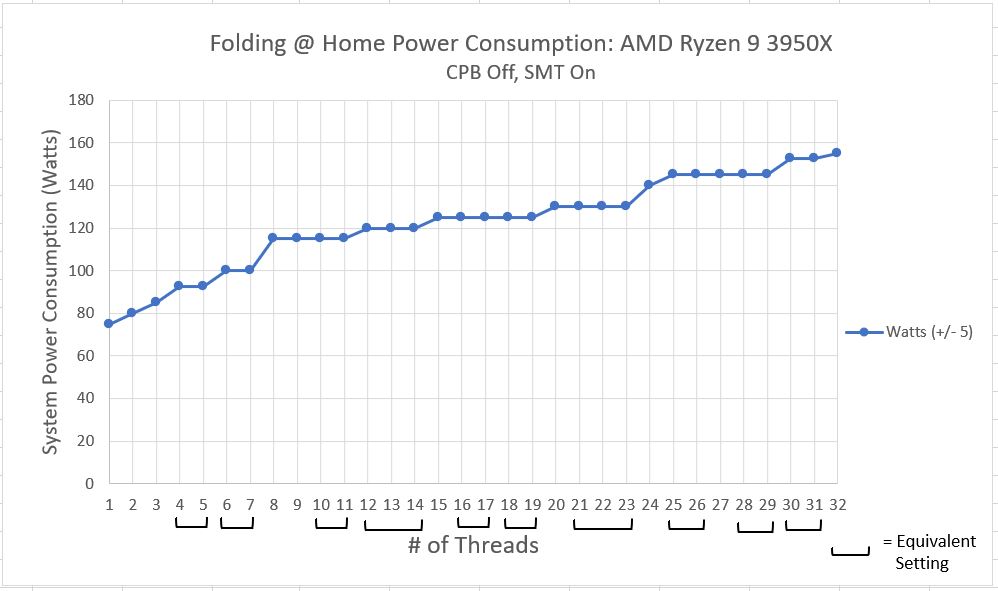
The total measured power consumption rose fairly linearly from just under 80 watts to just under 160 watts. There’s not too much surprising here. As you throw more threads at the CPU, it clocks up idle cores and does more work (which causes more transistors to switch, which thus takes more power). This seems pretty believable to me. At the high end, the system is drawing just under 160 watts of power. The AMD Ryzen 9 3950x is rated at a 105 watt TDP, and with CPB turned off it should be pretty close to this number. My rough back of the hand calculation for this rig was as follows:

  1. CPU Loaded Power = 105 Watts
  2. GPU Idle Power (Nvidia GTX 1650) = 10 Watts
  3. Motherboard Power = 15 Watts
  4. Ram Power = 2 watts * 4 sticks = 8 watts
  5. NVME Power = 2 watts * 2 drives = 4 watts
  6. SSD Power = 2 watts

Total Estimated Watts @ F@H CPU Load = 144 Watts

Factor in a boat load of case fans, some silly LED lights, and a bit of PSU efficiency hit (about 90% efficient for my Seasonic unit) and it’ll be close to the 160 watts as measured.

Efficiency

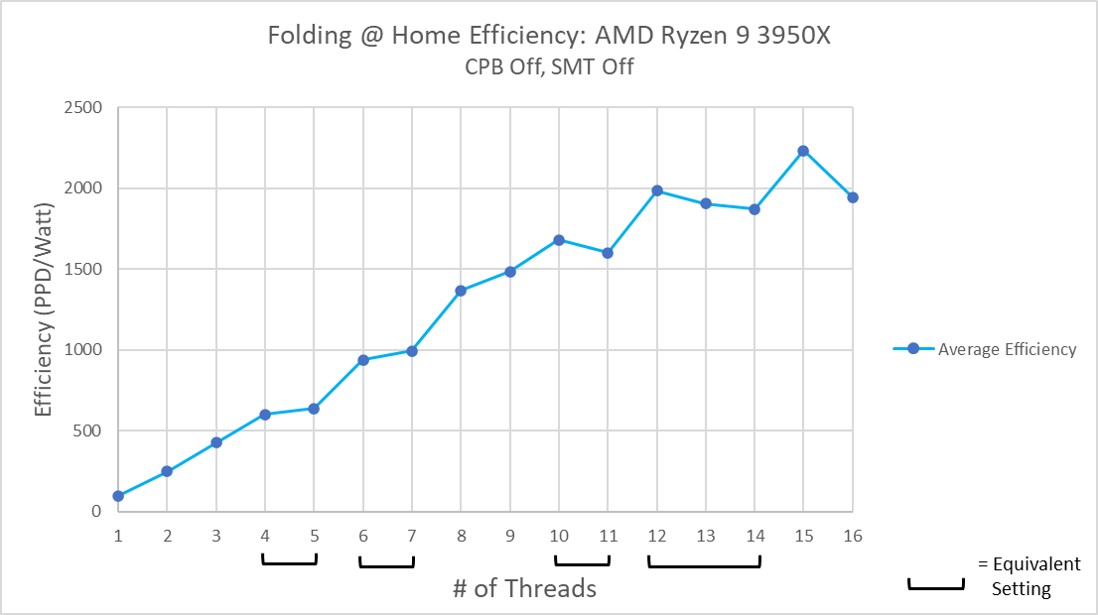
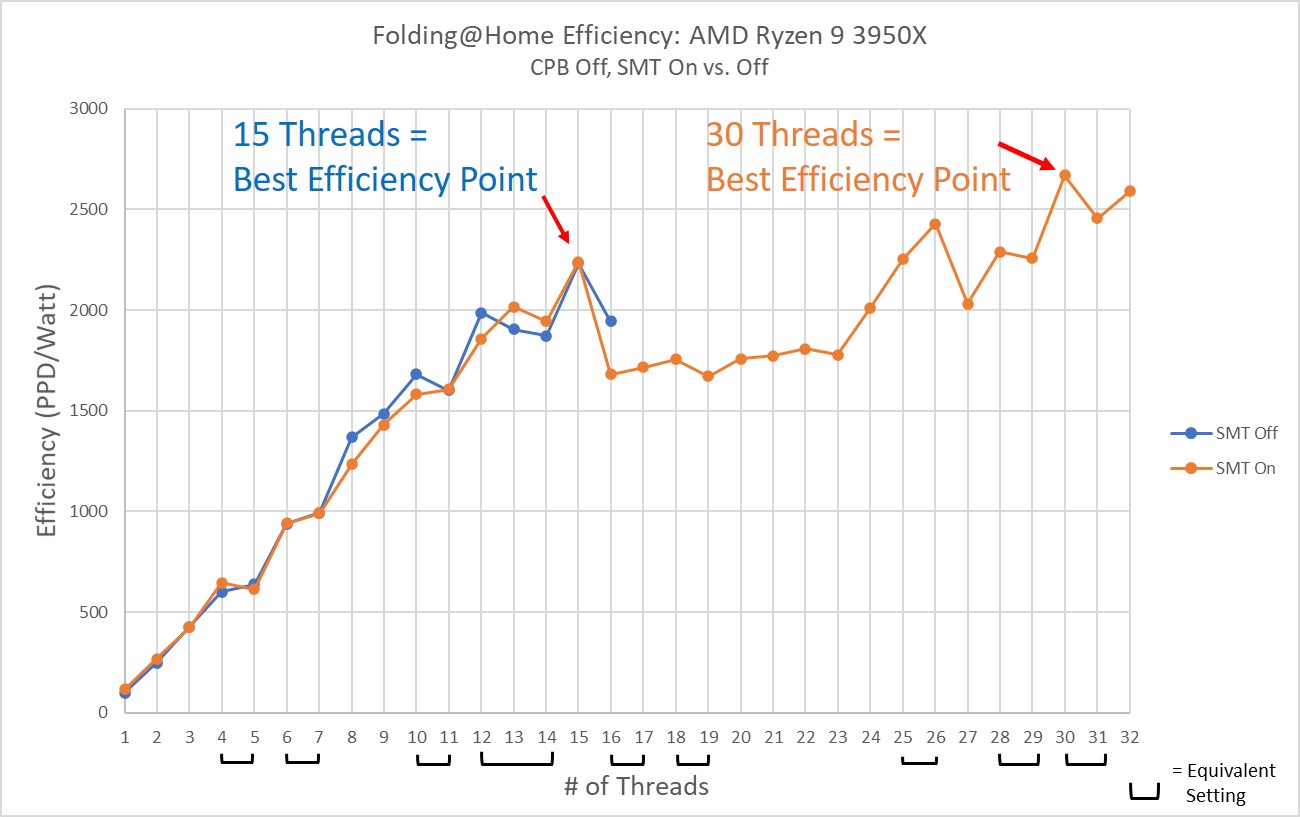
This being a blog about saving the planet while still doing science with computers, I am very interested in energy efficiency. For Folding@Home, this means at doing the most work (PPD) for the least amount of power (watts). So, this plot is just PPD/Watts. Easy!

Similar to the PPD plot, this efficiency plot averages five data points for each thread setting. I chose to leave off the individual points and the confidence interval, because that looks about the same on this plot as it does on the PPD plot, and leaving all the clutter off makes this easier to read.

Ryzen_3950x_Efficiency_SMT_Off_CPB_On

As with the PPD plot, there seem to be two regions on the efficiency curve. The first region (threads less than 16) shows a pretty good linear ramp-up in efficiency as more threads are added. The second region (threads 16 or greater) is what I’m calling the “core saturation” region. Here, there are more threads than physical cores, and efficiency stays relatively flat. It actually drops off at 16 cores (similar to the PPD plot), and doesn’t start improving again until 24 or more threads are allocated to the solver.

This plot, at first glance, suggests that the maximum efficiency is realized at # of threads = 30. However, it should be noted that work unit variation still has a lot of influence, even with reporting results of a 5-sample average. You can see this effect by looking at the efficiency drop at threads = 31. Theoretically, the efficiency should be the same at threads = 31 and threads = 30, because the solver runs a 30-thread solution even when set to 31 to prevent domain decomposition.

Thus, similar to the PPD plot, I’d say the max efficiency is effectively achieved at thread counts of 30 and 32. My personal opinion is that you might as well run with # of threads = 30 (leaving two threads free for other tasks). This setting results in the maximum PPD as well.

Weird Results at Threads = 16-23

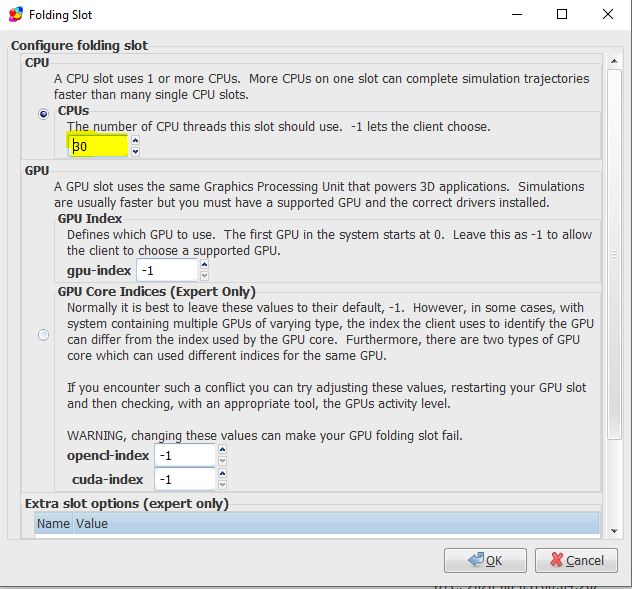
Some of you might be wondering why the performance and efficiency drops off when the thread count is set to the actual number of cores (16) or higher. I was too, so I re-ran some tests and looked at what was happening with AMD’s built-in Ryzen Master tool. As you can see in the screen shot below, even though the # of threads was set to 18 in Folding@Home (a number greater than the 16 physical cores), not all 16 cores were fully engaged on the processor. In fact, only 14 were clocked up, and two were showing relatively lazy clock rates.

Two Cores are Lazy!

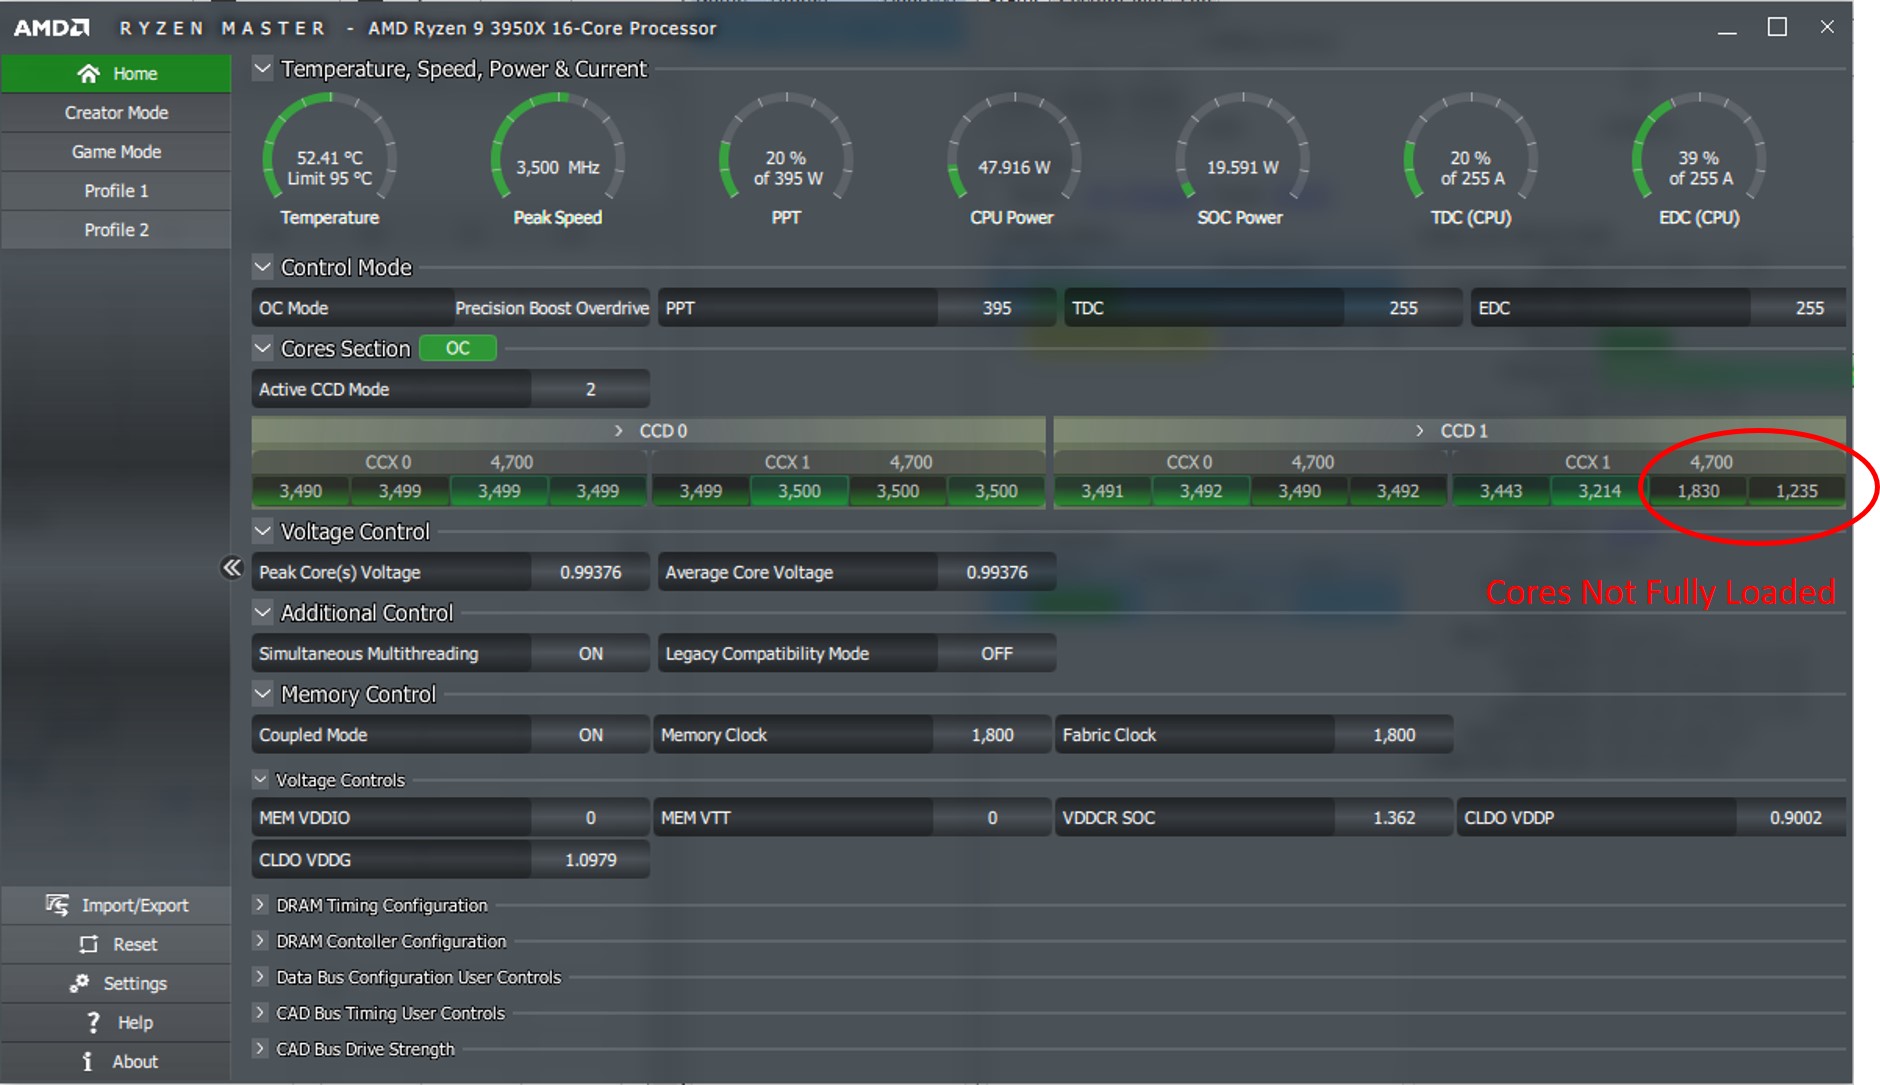
Folding@Home 18-Thread CPU Solve on 16-Core Processor

I suspect what is happening is that some of the threads were loaded onto “virtual” CPU cores (i.e. SMT / hyper threading). This might be something Windows 10 does to preserve a few free CPU cores for other tasks. In fact, I didn’t see all of the cores turbo up to full speed until I set Folding@Home’s thread count to 24. This incidentally is when performance starts coming back in on the plots above.

This weird SMT / Hyper-threading behavior is likely what is responsible for the large drop-off / flat part of the performance and efficiency curves that exists from thread count = 16 to 23. As you can see in the picture below, once you fully load all the available threads, the CPU frequencies on each core all hit the maximum value, as expected.

Ryzen_Master_32_Thread_Solve

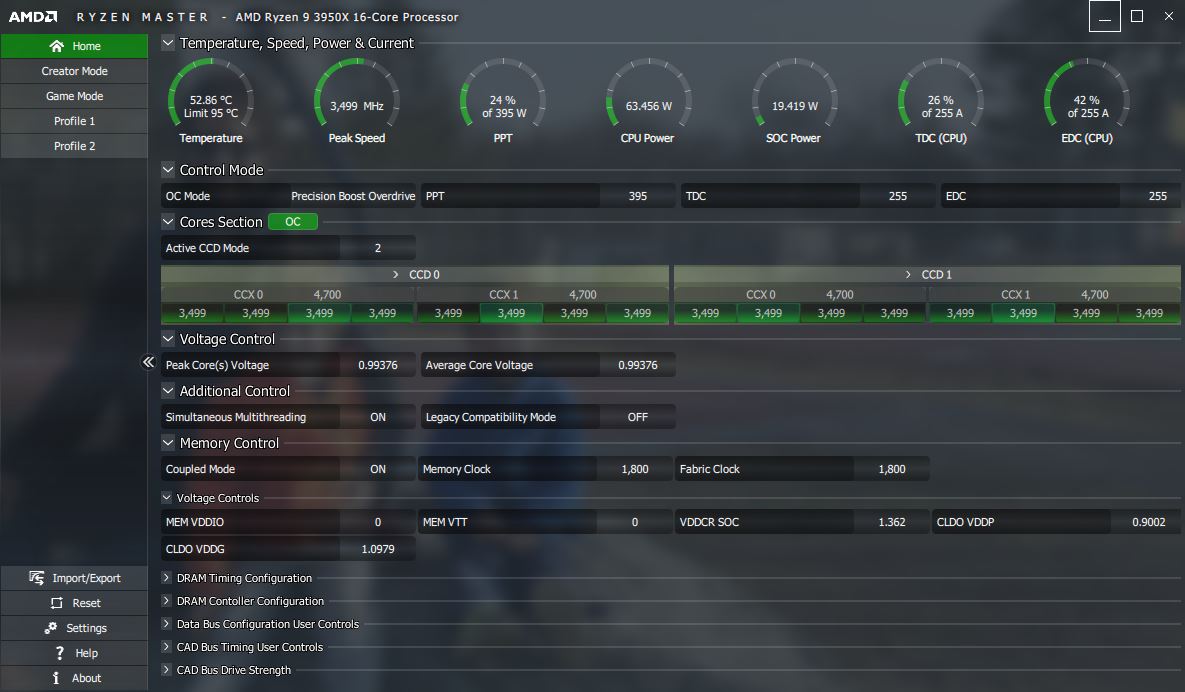
Folding@Home 32-Thread CPU Solve on 16-Core Processor

Results Comparison

The following plots compare overall performance, power consumption, and efficiency of my new AMD Ryzen 9 3950x Folding@Home rig to other hardware configurations I have tested so far.
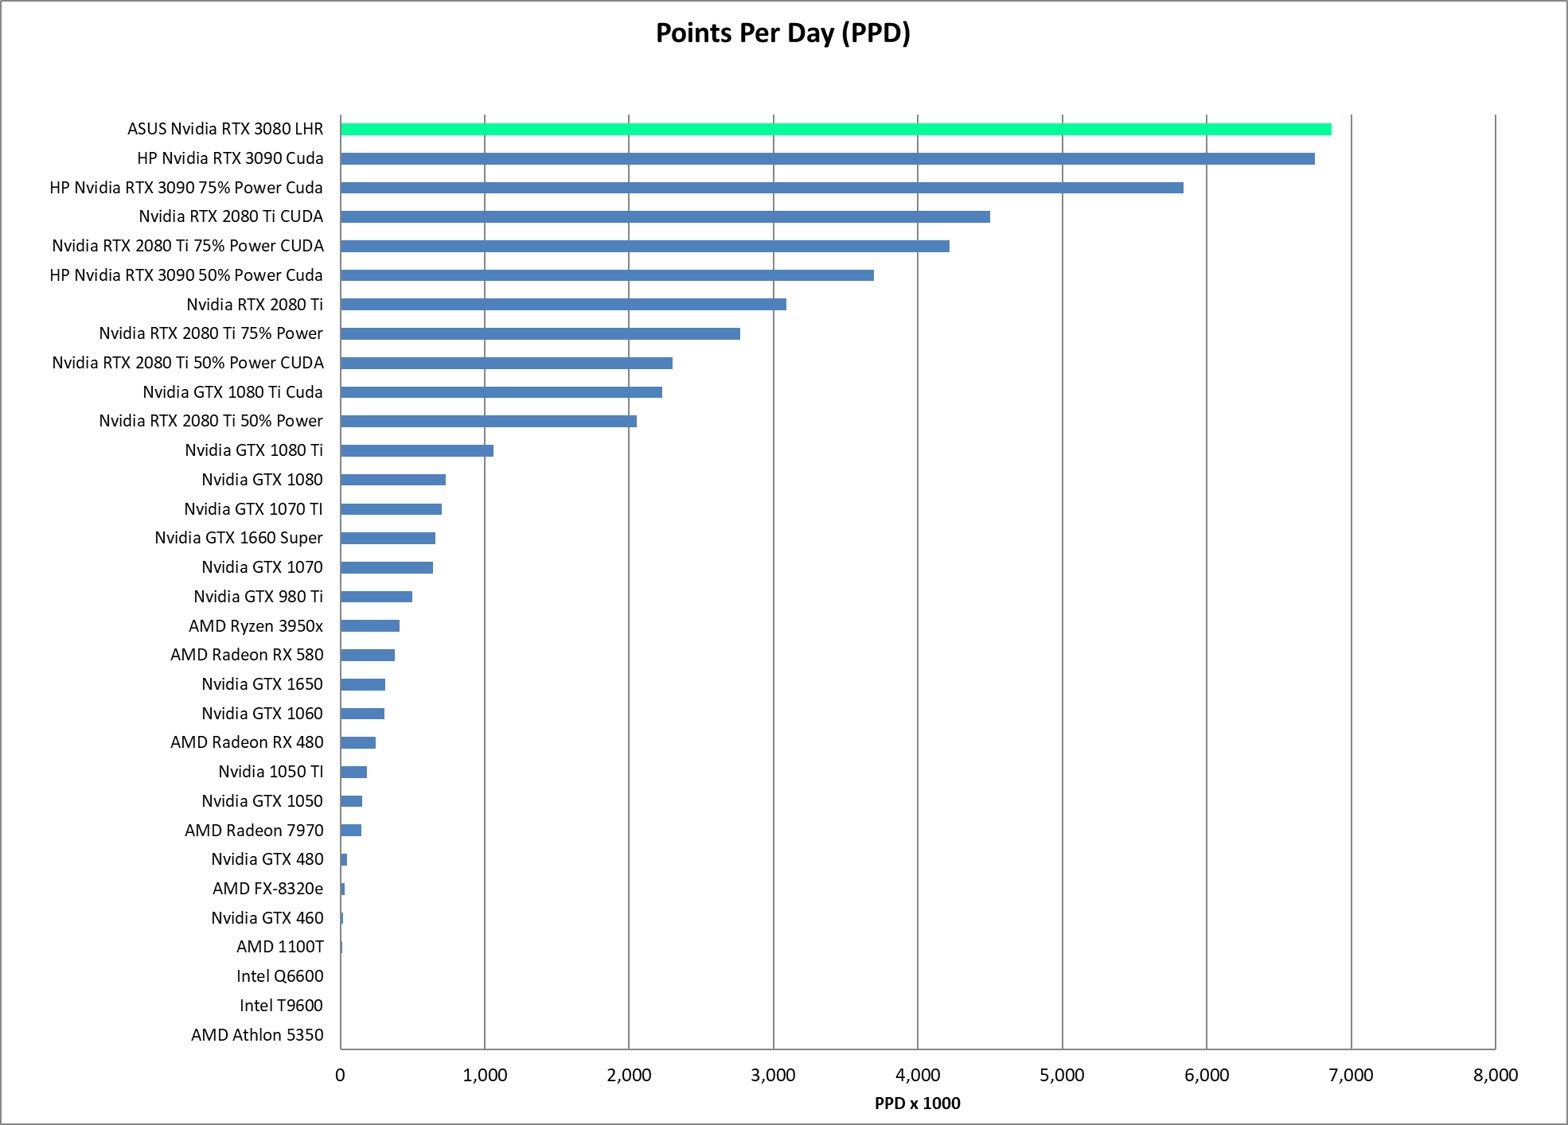
Performance

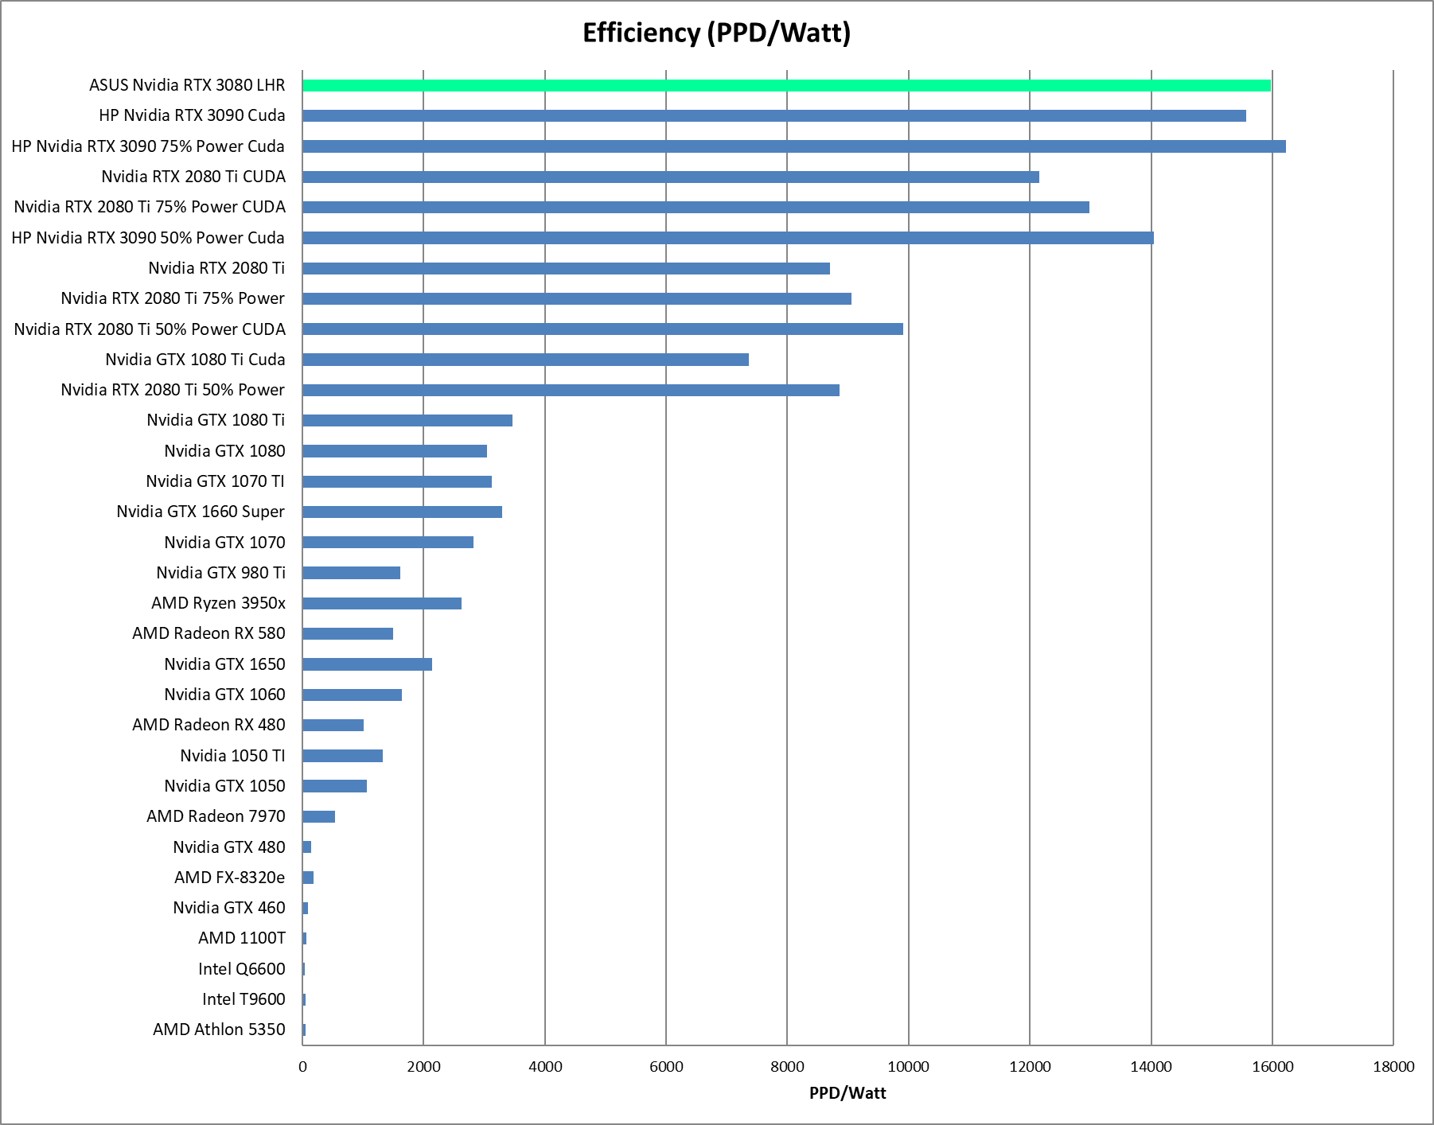
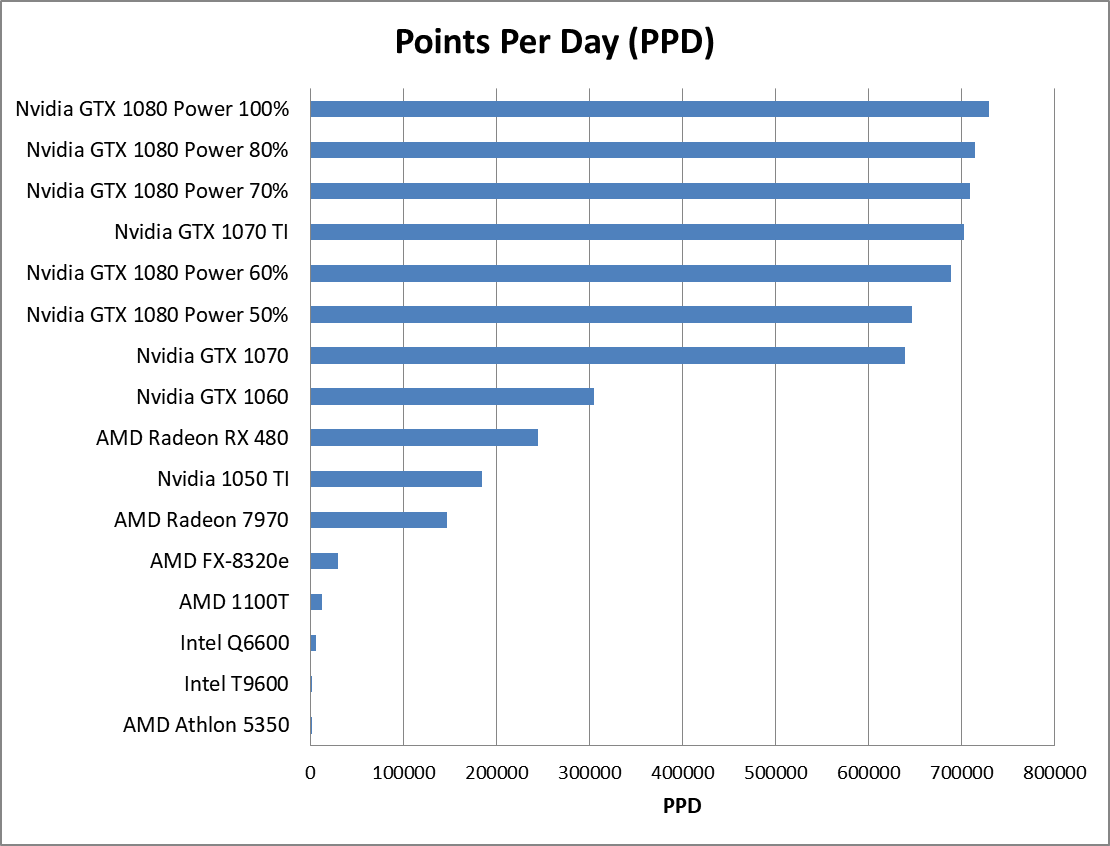
As you can see from the plot below, the Ryzen 9 3950x running a 32-thread Folding@Home solve can compete with relatively modern graphics cards in terms of raw performance. High-end GPUs will still offer more performance, but for a processor, getting over 400K PPD is very impressive. This is significantly more PPD than the previous processors I have tested (AMD Bulldozer-based FX-8320e, AMD Phenom II X6 1100t, Intel Core2Quad Q6600, etc). Admittedly I have not tested very many CPUs, since this is much more involved than just swapping out graphics cards to test.
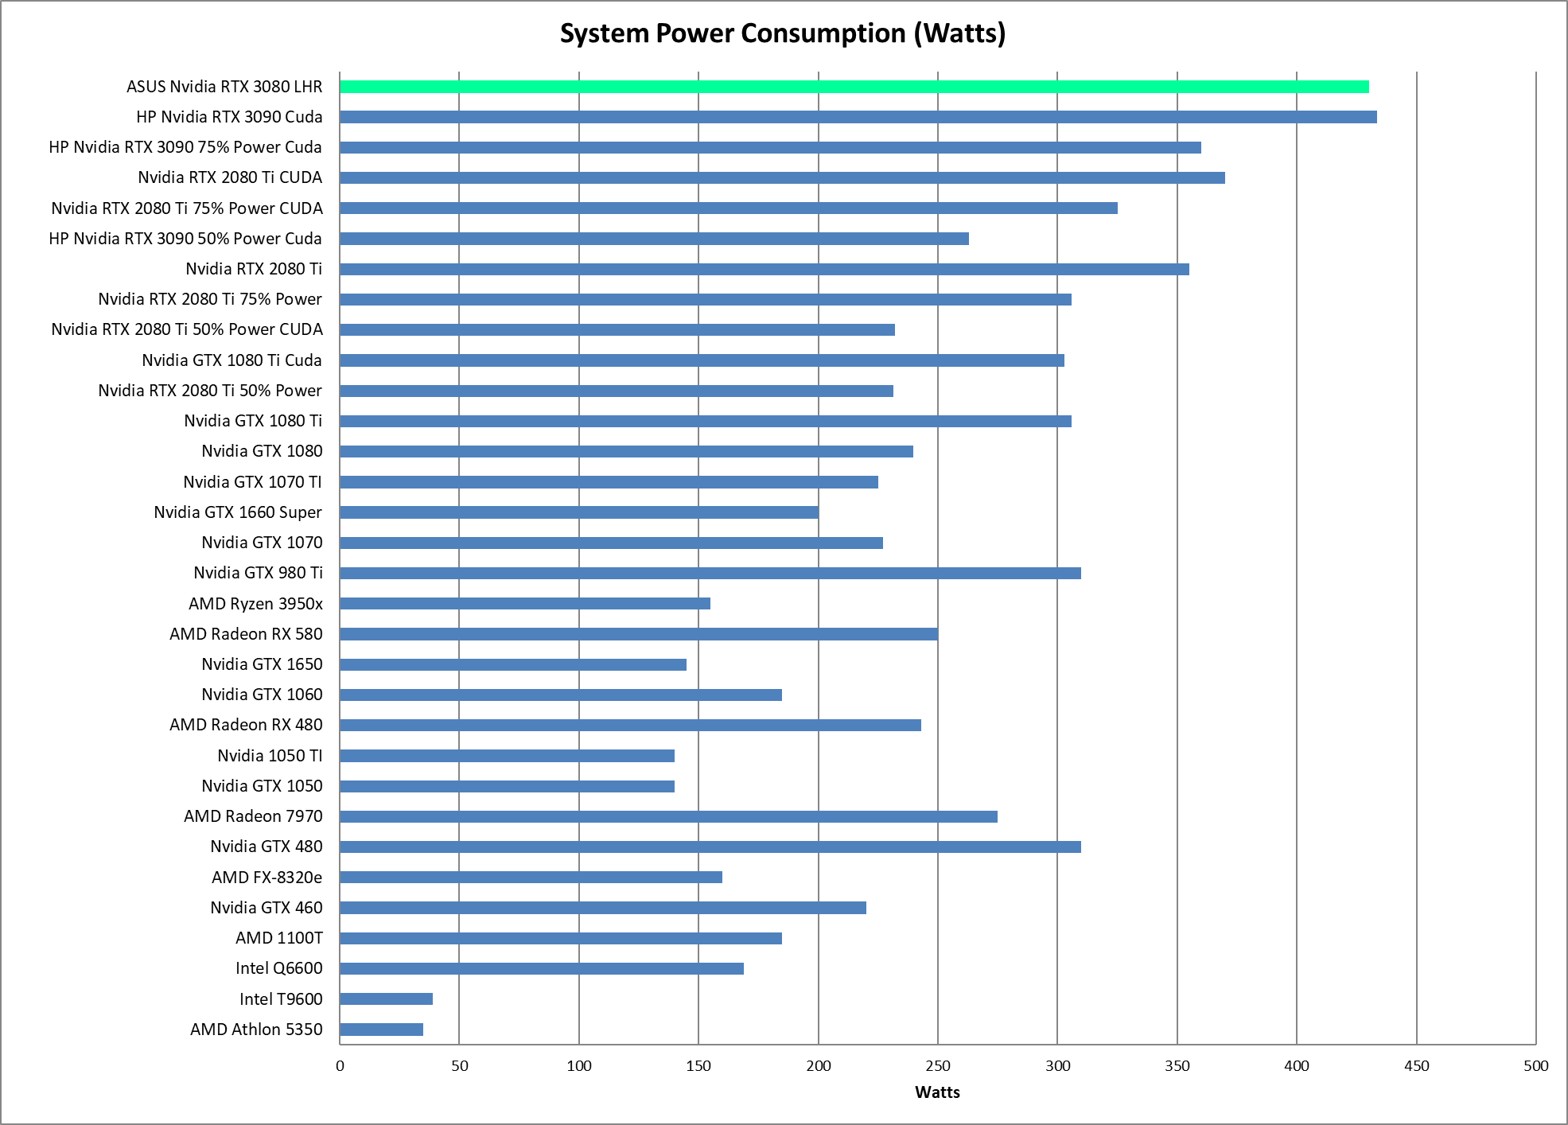
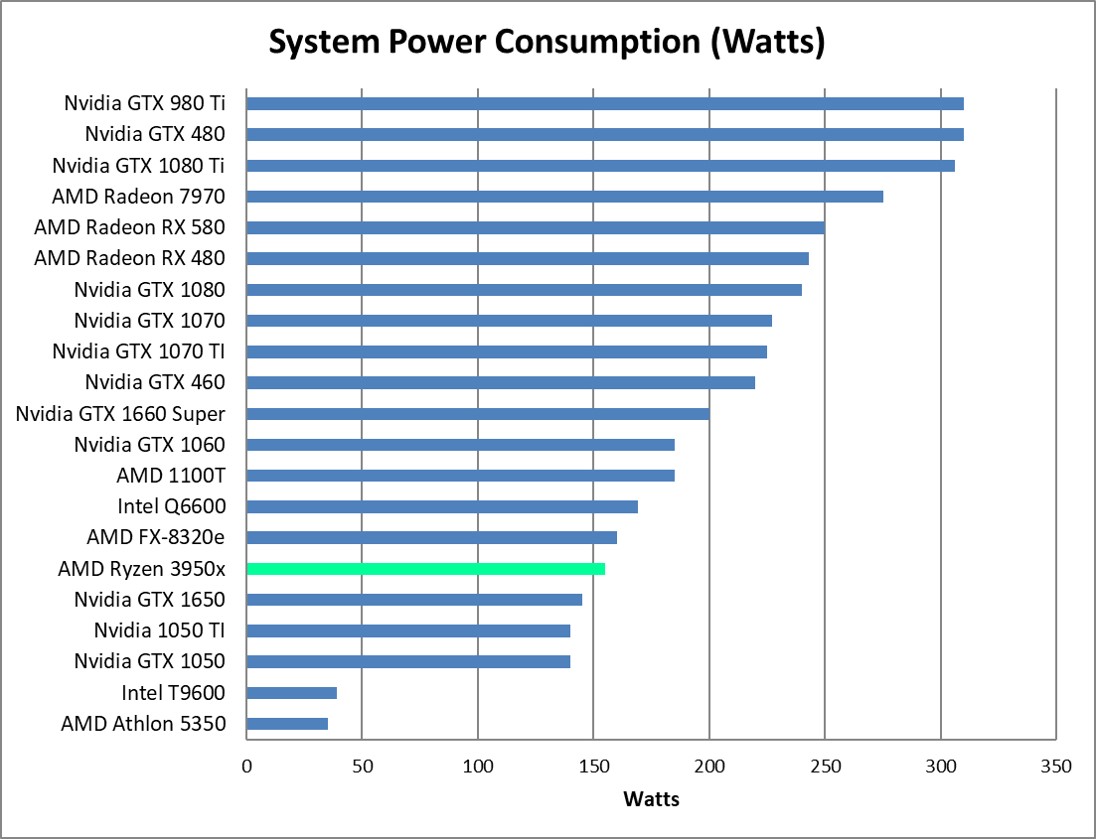
AMD Ryzen 9 3950x Performance

Power Consumption

From a total system power consumption standpoint, my new benchmark machine with the AMD Ryzen 9 3950x has a surprisingly low total power draw when running Folding. Another interesting point is that since the 3950x lacks onboard graphics, I had to have a graphics card installed to get display. In my case, I had the Nvidia GTX 1650 installed, since this is a relatively low power consumption card that should provide minimal overhead. As you can see below, folding on the 3950x CPU (with the 1650 GPU idle) uses nearly the same amount of power as folding on the 1650 GPU (with the 3950x idle).
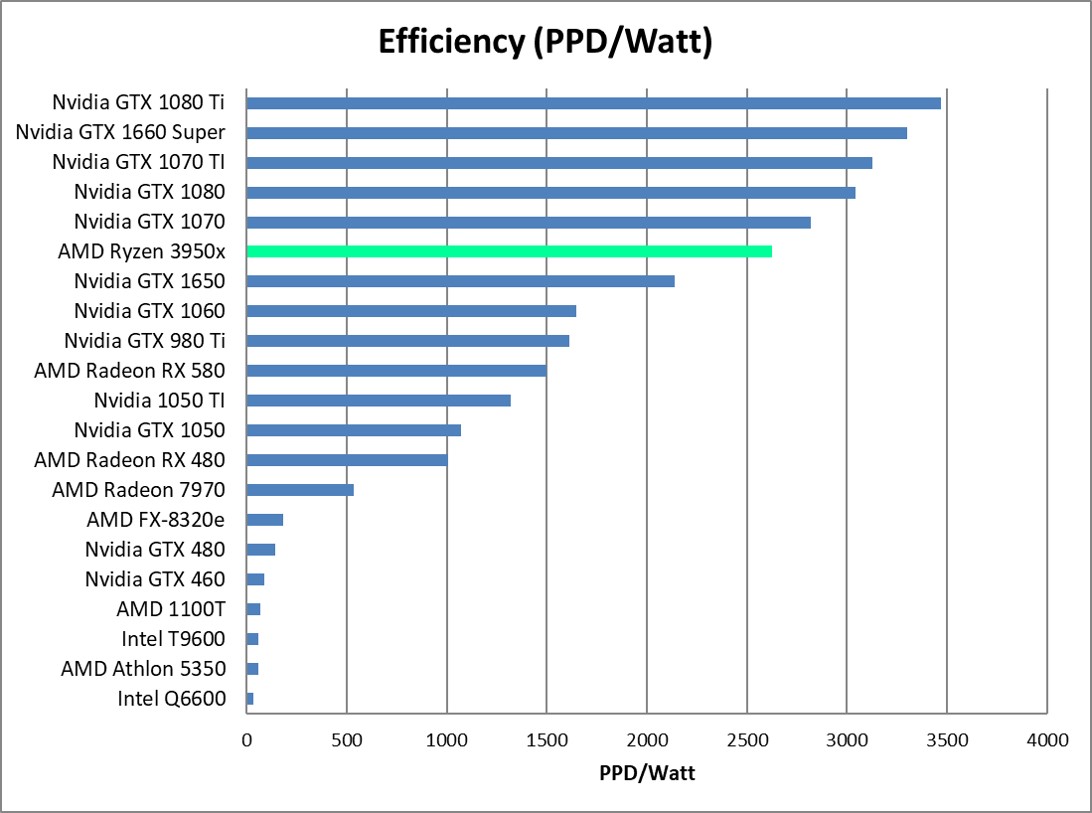
AMD Ryzen 9 3950x Power Consumption

Efficiency

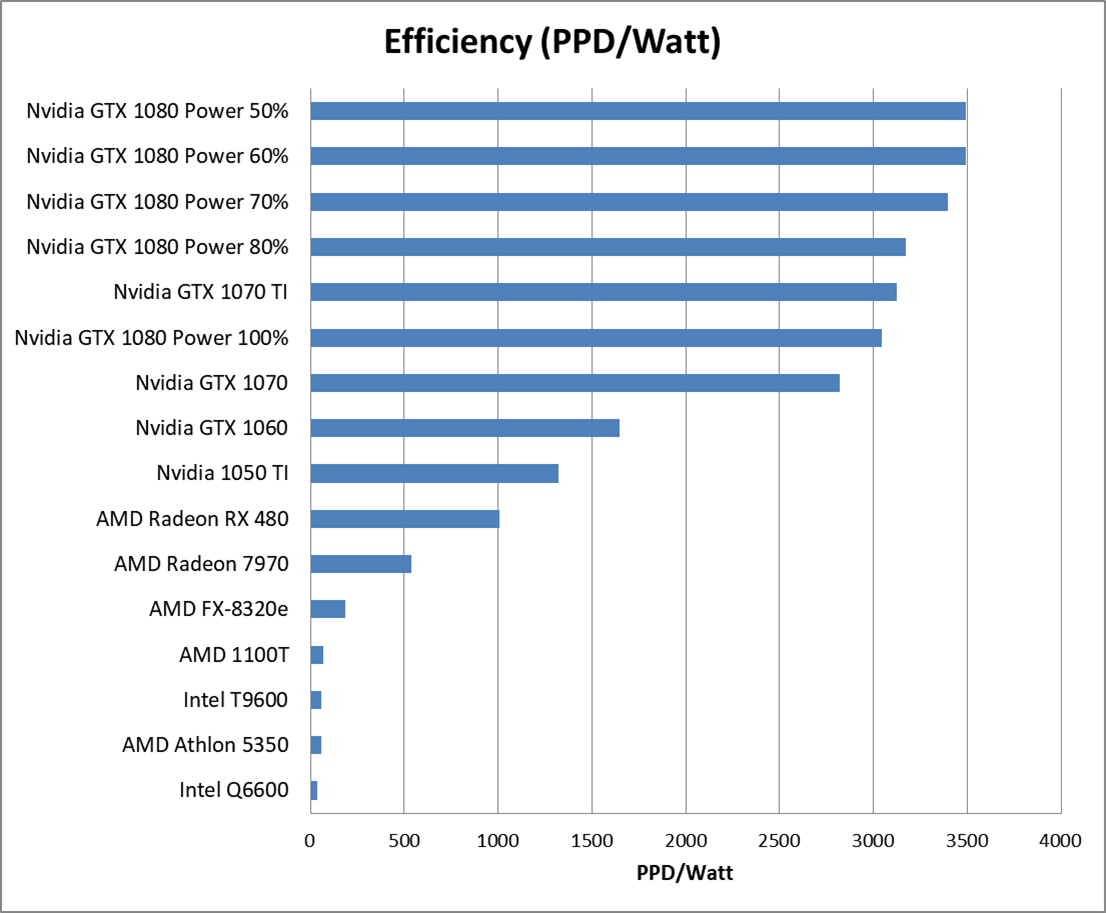
Efficiency is the point of this blog, and in this respect the 3950x comes in towards the upper middle of the pack of hardware configurations I have tested. It’s definitely the most efficient processor I have tested so far, but graphics cards such as the 1660 Super and 1080 Ti are more efficient. Despite drawing more total power from the wall, these high-end GPUs do a lot more science.

Still, a PPD/Watt of over 2500 is not bad, and in this case the 3950x is more efficient than folding on the modest GPU installed in the same box (the Nvidia GTX 1650). Compared to the much older AMD FX-8320e, the Ryxen 9 3950x is 14x more efficient! What a difference 7 years can make!

AMD Ryzen 9 3950x Efficiency

Conclusion

The 16-core, 32-thread AMD Ryzen 9 3950x is one fast processor, and can do a lot of science for the Folding@Home distributed computing project. Although mid to high-end graphics cards such as the 1080 Ti ($450 on the used market) can outperform the $700 3950x in terms of performance and efficiency, it is still important to have a smattering of high-end CPU folding rigs on the Folding@Home network, because some molecules can only be solved on CPUs.

There is a general trend of increasing efficiency and performance as the # of CPU threads allocated to Folding@Home increases. For the Ryzen 9 3950x, using a setting of 30 or 32 threads is recommended for maximum performance and efficiency. If you plan on using your computer for other tasks, or for simultaneously folding on the GPU, 30 threads is the ideal CPU slot setting.

Please Support My Blog!

If you are interested in measuring the power consumption of your own computer (or any device), please consider purchasing a P3 Kill A Watt Power Meter from Amazon. You’ll be surprised what a $35 investment in a watt meter can tell you about your home’s power usage, and if you make a few changes based on what you learn you will save money every year! Using this link won’t cost you anything extra, but will provide me with a small percentage of the sale to support the site hosting fees of GreenFolding@Home.

If you enjoyed this article, perhaps you are in the market for an AMD Ryzen 9 3950x or similar Ryzen processor. If so, please consider using one of the links below to buy one from Amazon. Thanks for reading!

AMD Ryzen 9 3950x Direct Link

AMD Ryzen (Amazon Search)

Future Work

In the next article, I’ll disable multithreading (SMT) to see the effect of virtualized CPU cores on Folding@Home performance.

Later, I plan to enable core performance boost on the 3950x to see what effect the automatic clock frequency and voltage overclocking has on Folding@Home performance and efficiency.


How to Make a Folding@Home Space Heater (and why would you want to?)

My normal posts on this site are all about how to do as much science as possible with Folding@Home, for the least amount of power. This is because I think disease research, while a noble and essential cause, shouldn’t be done without respecting the environment.

With that said, I think there is a use case for a power-hungry, inefficient Folding@Home computer. Namely, as a space heater for those in colder climates.

The logic is this: Running Folding@Home, or any other piece of software, makes your computer do work. Electricity flows through the circuits, flipping tiny silicon switches, and producing heat in the process. Ultimately all of the energy that flows into your computer comes back out as heat (well, a small amount comes out as light, or electromagnetic radiation, or noise, but all of those can and do get converted back into heat as they strike things in the room).

Have you ever noticed how running your gaming computer with the door to your room closed makes your feet nice and toasty in the winter? It’s the same idea. Here, one of my high-performance rigs (dual NVidia 980 Ti GPUs) is silently humming away, putting off about 500 watts of pleasant heat. My son is investigating:

My Folding@Home Space Heater Experiment

Folding@Home uses CPUs and GPUs to run molecular dynamic models to help research understand and fight diseases. You get the most points per day (PPD) by using cutting-edge hardware, but the Folding@Home Consortium and Stanford University openly encourage everyone to run the software on whatever they happen to have.

With this in mind, I started thinking about all the old hardware that is out there…CPUs and graphics cards that are destined for landfills because they are no longer fast enough to do any useful gaming or decode 4K video. People describe this type of hardware as “bricks” or “space heaters”–useful for nothing other than wasting power.

That gave me an idea…

It didn’t take me long to find a sweet deal on an nForce 680i-based system on eBay for $60 shipped (EVGA board with Nvidia n680i chipset, supporting three full-length PCI-E X16 slots). I swapped out the Core 2 Duo that this machine came with for a Core 2 Quad, and purchased four Fermi-based Nvidia graphics cards, plus a used 1300 Watt Seasonic 80+ Gold power supply. All of this was amazingly cheap. The beautiful Antec case was worth the $60 cost of the parts that came with it alone. Because I knew lots of power would be critical here, I spent most of the money on a high-end power supply (also used on eBay). Later on, I found that I needed to also upgrade the cooling (read: cut a hole in the side panel and strap on some more fans).

  • Antec Mid-Tower Case + Corsair 520 Watt PSU, EVGA 680i motherboard, Core 2 Duo CPU, 4 GB Ram, CD Drives, and 4 Fans = $60
  • 2x EVGA Nvidia GeForce GTX 480 graphics cards: $40
  • 1 x EVGA NVidia GeForce GTX 580 Graphics Card: $50
  • 1 x EVGA NVidia GeForce GeForce GTX 460 Graphics Card: $20
  • 1 x PCI-E X1 to X16 Riser: $10
  • 1 x Core 2 Quad Q6600 CPU (Socket 775) – $6
  • 1 x Seasonic 1300 Watt 80+ Gold Modular Power Supply: $90
  • 2 x Noctua 120 MM fans + custom aluminum bracket (for modifying side panel): $60
  • 1 x Arctic Cooling Freezer Tower Cooler – $10
  • 1 x Western Digital Black 640GB HDD – $10

Total Cost (Estimated): $356

This is the cost before I sold some of the parts I didn’t need (Core 2 Duo, Corsair PSU, etc).

Here is a shot of the final build. It took a bit of tweaking to get it to this point.

F@H_Space_Heater_Quad_GPUs

Used Parts Disclaimer!

Note that when dealing with used parts on eBay, it’s always good to do some basic service. For the GPUs in this build, I took them apart, cleaned them, applied fresh thermal paste (Arctic MX-4), and re-assembled. It was good that I did…these cards were pretty gross, and the decade-old thermal paste was dried on from years of use.


I mean, come on now, look at the dust cake on the second GTX 480! Clean your graphics cards, random eBay people!

GTX 480 Dust

Here’s how the 3 + 1 GPUs are set up. The two GTX 480s and the GTX 580 are on the mobo in the X16 slots. I remotely mounted the GTX 460 in the drive bay. I used blower-style (slot exhaust) cards on purpose here, because they exhaust 100% of the hot air outside the case. Open-fan style cards would have overheated instantly in this setup.

To keep costs down, I just used Ubuntu Linux as the operating system. I configured the machine for 4-slot GPU folding using proprietary Nvidia drivers. Although I ultimately control all of my remote Linux machines with TeamViewer, it is helpful to have a portable monitor and combo wireless keyboard/mouse for initial configuration and testing. In the shot below (of an earlier config), I learned a lot just trying the get the machine stable with 3 cards.

Space_Heater_Early_Config_Initial_Fireup_small

Initial Testing on the Space Heater (3 GPUs installed). This test showed me that I needed better CPU cooling (hence I chucked that stock Intel cooler)

I also did some thermal testing along the way to make sure things weren’t getting too hot. It turns out this testing was a bit misleading, because the system was running a lot cooler with the side panel off than with it on.

Some Thermal Camera Images During Initial Burn-In (3 GPUs, stock CPU cooler):

Now that’s some heat coming out of this beast! Thankfully, the upgraded 14-gauge power plug and my watt meter aren’t at risk of melting, although they are pretty warm.

Once I had the machine up and running with all four GPUs the final configuration, I found that it produced about 55-95K PPD on average (based on the work unit), with the following breakdown

  • GTX 460: 10-20K PPD
  • GTX 480: 20-30K PPD each
  • GTX 580: 25-45 K PPD

Power consumption, as measured at the wall, ranged from 900 to 1000 watts with all 4 GPUs engaged. By turning different GPUs on and off, I could get varying levels of power (about 200 Watts idle. I typically ran it with one 580 and one 480 folding, for an average power consumption of about 600 watts).

Space_Heater_Power_Consumption

After running the machine for a while, my room was nice and toasty, as expected!

One thing that I should mention was the effect of the two additional intake fans that I mounted in the side panel. Originally I did not have these, and the top graphics card in the stack was hitting 97 degrees C according to the onboard monitoring! After modding this custom side-intake into the case (found a nice fan bracket on Amazon, and put my dremel tool to good use), the temps went down quite a lot. I used fan grilles on the inside of the fans to keep internal cables out of them, and mesh filters on the outside to match the intake filters on the rest of the case.


The top card stays under 85 degrees C (with the fan at 50%). The middle card stays under 80 degrees C, and the bottom card runs at 60 degrees C. The GTX 460 mounted in the drive bay never goes over 60 degrees C, but it’s a less powerful card and is mounted on the other side of the case.

Here’s some more pictures of the modded side panel, along with a little cooling diagram I threw together:

PPD, Wattage, and Efficiency Comparison

I debated about putting these plots in here, because the point of this machine was not primarily to make points (pun intended), or to be efficient from a PPD/Watt perspective. The point of this machine was to replace the 1500 watt space heater I use in the winter to keep a room warm.

As you can see, the scientific production (PPD) on this machine, even with 4 GPUs, is not all that impressive in 2020, since the GPUs being used are ten years old. Similarly, the efficiency (PPD/Watt) is terrible. There’s no surprise there, since it averages just under 1000 watts of power consumption at the wall!

Conclusion

It is totally possible to build a (relatively) inexpensive desktop computer out of old, used parts to use as a space heater. If the primary goal is to make heat, then this might not be a bad idea (although at $350, it still costs way more than a $20 heater from Walmart). The obvious benefit is that this sort of space heater is actually doing something useful besides keeping you warm (in this case, helping scientists learn more about diseases thanks to Folding@Home).

Other benefits that I found were the remote control (TeamViewer), which lets me use my cellphone to turn GPUs on and off to vary the heat output. Also, I think running this machine for extended durations in its medium-high setting (700 watts or so) is much healthier for the electrical wiring in my house vs. the constant cycling on and off of a traditional 1500 watt space heater.

From an environmental standpoint, you can do much worse than using electric heat. In my case, electric space heaters make a lot of sense, especially at night. I can shut off the entire heating zone (my house only has two zones) to the upstairs and just keep the bedroom warm. This drastically reduces my fossil fuel usage (good old New England, where home heating oil is the primary method of keeping warm in the winter). Since my house has an 8.23 KW solar panel array on the roof, a lot of my electricity comes directly from the sun, making this electric heat solution even greener.

Parting Thoughts:

I would not recommend running a machine like this during the warmer months. If warm air is not wanted, all the waste heat from this machine will do nothing but rack up your power bill for relatively little science being done. If you want to run an efficient summer-time F@H rig that uses low power (so as to not fight your AC) , check out my article on the GTX 1660 and 1650.

In a future article, I plan to show how I actually saved on heating costs by running Folding@Home space heaters all last winter (with a total of seven Folding@Home desktops placed strategically throughout my house, so that I hardly had to burn any oil).


New Folding@Home Benchmark Machine: It’s RYZEN TIME!

Folding@Home, the distributed computing project that fights diseases such as COVID-19 and cancer, has hit an all-time high in popularity. I’m stunned to find that my blog is now getting more views every day than it did every month last year. With that said, this is a perfect opportunity to reach out and see if all the new donors are interested in tuning their computers for efficiency, to save a little on power, lighten the burden on your wallet, and hopefully produce nearly the same amount of science. If this sounds interesting to you, let me know in the comments below!

In my last post, I noted that the latest generation of graphics cards are starting to push the limits of what my primary GPU Folding@Home benchmark rig can do. That computer is based on an 11-year-old chipset (AMD 880), and only supports PCI-Express 2.0. In order for me to keep testing modern fast graphics cards in Windows 10, I wanted to make sure that PCI-Express slot bandwidth wasn’t going to artificially bottleneck me.

So, without further ado, let me present the new, re-built Folding@Home rig, SAGITTA:

Sagitta Desktop

I’ve (re)created a monster!

This build leverages the Raidmax Sagitta case that I’ve had since 2006. This machine has hosted multiple builds (Pentium D 805, Core 2 Duo e8600, Core 2 Quad Q6600, Phenom II X6 1100T, and the most recent FX-8320e Bulldozer). There have been too many graphics cards to count, but the latest one (Nvidia GTX 1650 by Zotac) was carried over for some continuity testing. The case fans and power supply (initially) were also the same since the previous FX build (they aren’t the same ones from back in 2006…those got loud and died long ago). I also kept my Blu-Ray drive and 3.5 inch card reader. That’s where the similarities end. Here is a specs comparison:

Sagitta Rebuild Benchmark Machine Specs

  • Note I ended up updating the power supply to the one shown in the table. More on that below…

System Power Consumption

Initially, the power consumption at idle of the new Ryzen 9 build, measured with my P3 Kill A Watt Meter, was 86 watts. The power consumption while running GPU Folding was 170 watts (and the all-core CPU folding was over 250 watts, but that’s another article entirely).

Using the same Nvidia GeForce GTX 1650 graphics card, these idle and GPU folding power numbers were unfortunately higher than the old benchmark machine, which came in at 70 watts idle and 145 watts load. This is likely due to the overkill hardware that I put into the new rig (X570 motherboards alone are known to draw twice the power of a more normal board). The system’s power consumption difference of 25 watts while folding was especially problematic for my efficiency testing, since new plots compared to graphics cards tested on the old benchmark machine would not be comparable.

To solve this, I could either:

A: Use a 25 watt offset to scale the new GPU F@H efficiency plots

B: Do nothing and just have less accurate efficiency comparisons to previous tests

C: Reduce the power consumption of the new build so that it matches the old one

This being a blog about energy efficiency, I decided to go with Option C, since that’s the one that actually helps the environment. Lets see if we can trim the fat off of this beast of a computer!

Efficiency Boost #1: Power Supply Upgrade

The first thing I tried was to upgrade the power supply. As noted here, the power supply’s efficiency rating is a great place to start when building an energy efficient machine. My old Seasonic X-650 is a very good power supply, and caries an 80+ Gold rating. Still, things have come a long way, and switching to an 80+ Titanium PSU can gain a few efficiency percentage points, especially at low loads.

80+ Table

80+ Efficiency Table

With that 3-5% efficiency boost in mind, I picked up a new Seasonic 750 Watt Prime 80+ Titanium modular power supply. At $200, this PSU isn’t cheap, but it provides a noticeable efficiency improvement at both idle and load. Other nice features were the additional 100 watts of capacity, and the fact that it supported my new motherboard’s dual pin (8 + 4) CPU aux power connection. That extra 4-pin isn’t required to make the X570 board work, but it does allow for more overclocking headroom.

Disclaimer: Before we get into it, I should note that these power readings are “eyeball” readings, taken by glancing at the watt meter and trying to judge the average usage. The actual number jumps around a bit (even at idle) as the computer executes various background tasks. I’d say the measurement precision on any eyeball watt meter readings is +/- 5 watts, so take the below with a grain of salt. These are very small efficiency improvements that are difficult to measure, and your mileage may vary. 

After upgrading the power supply, idle power dropped an impressive 10 watts, from 86 watts to 76. This is an awesome 11% efficiency improvement. This might be due to the new 80+ Titanium power supply having an efficiency target at very low loads (90% efficiency at 10% load), whereas the old 80+ Gold spec did not have a low load efficiency requirement. Thus, even though I used a large 750 watt power supply, the machine can still remain relatively efficient at idle.

Under moderate load (GPU folding), the new 80+ titanium PSU provided a 4% efficiency improvement, dropping the power consumption from 170 watts to 163. This is more in line with expectations.

Efficiency Boost #2: Processor Underclock / Undervolt

Thanks to video gaming mentality, enthusiast-grade desktop processors and motherboards are tuned out of the box for performance. We’re talking about blistering fast, competition-crushing benchmark scores. For most computing tasks (such as running Folding@Home on a graphics card), this aggressive CPU behavior is wasting electricity while offering no discernible performance benefit. Despite what my kid’s shirt says, we need to reel these power hungry CPUs in for maximum GPU folding efficiency.

Never Slow Down

Kai Says: Never Slow Down

One way to improve processor efficiency is to reduce the clock rate and associated voltage. I’d previously investigated this here. It takes exponentially more voltage to support high frequencies, so just by dropping the clock rate by 100 MHz or so, you can lower the voltage a bunch and save on power.

With the advent of processors that up-clock and up-volt themselves (as well as going in the other direction), manual tuning can be a bit more difficult. It’s far easier to first try the automatic settings, to see if some efficiency can be gained.

But wait, this is a GPU folding benchmark rig? Why does the CPU’s frequency and power settings matter?

For GPU folding with an Nvidia graphics card, one CPU core is fully loaded per GPU slot in order to “feed” the card. This is because Nvidia’s implementation of open CL support using a polling (checking) method. In order to keep the graphics card chugging along, the CPU constantly checks on the GPU to see if it needs any data. This polling loop is not efficient and burns unnecessary power. You can read more about it here: https://foldingforum.org/viewtopic.php?f=80&t=34023. In contrast, AMD’s method (interrupts) is a much more graceful implementation that doesn’t lock up a CPU core.

The constant polling loop drives modern gaming-oriented processors to clock up their cores unnecessarily. For the most part, the GPU does not need work at every waking moment. To save power, we can turn down the frequency, so that the CPU is not constantly knocking on the GPU’s metaphorical door.

To do this, I disabled AMD’s Core Performance Boost (CPB) in the AMD Overclocking section of the BIOS (same thing as Intel’s Turbo Boost). This caps the processor speed at the base maximum clock rate (3.5 GHz for the Ryzen 9 3950x), and also eliminates any high voltage values required to support the boost clocks.

Success! GPU folding total system power consumption is now much lower. With less superfluous power draw from the CPU, the wattage is much more comparable to the old Bulldozer rig.

Ryzen 9 3950x Power Reduction Table

It is interesting that idle power consumption came down as well. That wasn’t expected. When the computer isn’t doing anything, the CPU cores should be down-clocked / slept out. Perhaps my machine was doing something in the background during the earlier tests, thus throwing the results off. More investigation is needed.

GPU Benchmark Consistency Check

I fired up GPU folding on the Nvidia GeForce GTX 1650, a card that I have performance data for from my previous benchmark desktop. After monitoring it for a week, the Folding@Home Points Per Day performance was so similar to the previous results that I ended up using the same value (310K PPD) as the official estimate for the 1650’s production. This shows that the old benchmark rig was not a bottleneck for a budget card like the GeForce GTX 1650.

Using the updated system power consumption of nominally 140 watts (vs 145 watts of the previous benchmark machine), the efficiency plots (PPD/Watt) come out very nearly the same. I typically consider power measurements of + / – 5 watts to be within the measurement accuracy of my eyeball on the watt meter anyway, due to normal variations as the system runs. The good news is that even with this variation, it doesn’t change the conclusion of the figure (in terms of graphics card efficiency ranking).

GTX 1650 Efficiency on Ryzen 9

* Benchmark performed on updated Ryzen 9 build

Conclusion

I have a new 16-core beast of a benchmark machine. This computer wasn’t built exclusively for efficiency, but after a few tweaks, I was able to improve energy efficiency at low CPU loads (such as Windows Idle + GPU Folding).

For most of the graphics cards I have tested so far, the massive upgrade in system hardware will not likely affect performance or efficiency results. Very fast cards, such as the 1080 Ti, might benefit from the new benchmark rig’s faster hardware, especially that PCI-Express 4.0 x16 graphics card slot. Most importantly, future tests of blistering fast graphics cards (2080 Ti, 3080 Ti, etc) will probably not be limited by the benchmark machine’s background hardware.

Oh, I can also now encode my backup copies of my blu-ray movies at 40 fps in H.265 in Handbrake (old speed was 6.5 fps on the FX-8320e). That’s a nice bonus too.

Efficiency Note (for GPU Folding@Home Users)

Disabling the automatic processor frequency and voltage scaling (Turbo Boost / Core Performance Boost) didn’t have any effect on the PPD being generated by the graphics card. This makes sense; even relatively slow 2.0 GHz CPU cores are still fast enough to feed most GPUs, and my modern Ryzen 9 at 3.5 GHz is no bottleneck for feeding the 1650. By disabling CPB, I shaved 23 watts off of the system’s power consumption for literally no performance impact while running GPU folding. This is a 16 percent boost in PPD/Watt efficiency, for free!

This also dropped CPU temps from 70 degrees C to 55, and resulted in a lower CPU cooler fan speed / quieter machine. This should promote longevity of the hardware, and reduce how much my computer fights my air conditioning in the summer, thus having a compounding positive effect on my monthly electric bill.

Future Articles

  • Re-Test the 1080 Ti to see if a fast graphics card makes better use of the faster PCI-Express bus on the AM4 build
  • Investigate CPU folding efficiency on the Ryzen 9 3950x


Shout out to the helpers…Kai and Sam

NVIDIA GEFORCE GTX 1080 Folding@Home Review (Part 2)

Welcome back. In the last article, I found that the GeForce GTX 1080 is an excellent graphics card for contributing to Stanford University’s charitable distributed computing project Folding@Home. For Part 2 of the review, I did some extended testing to determine the relationship between the card’s power target and Folding@Home performance & efficiency.

Setting the graphics card’s power target to something less than 100% essentially throttles the card back (lowers the core clock) to reduce power consumption and heat. Performance generally drops off, but computational efficiency (performance/watt of power used) can be a different story, especially for Folding@Home. If the amount of power consumed by the card drops off faster than the card’s performance (measured in Points Per Day for Folding@Home), then the performance can actually go up!

Test Methodology

The test computer and environment was the same as in Part 1. Power measurements were made at the wall with a P3 Kill A Watt meter, using the KWH function to track the total energy used by the computer and then dividing by the recorded uptime to get an average power over the test period. Folding@Home PPD Returns were taken from Stanford’s collection servers.

To gain useful statistics, I set the power limit on the graphics card driver via MSI Afterburner and let the card run for a week at each setting. Averaging the results over many days is needed to reduce the variability seen across work units. For example, I used an average of 47 work units to come up with the performance of 715K PPD for the 80% Power Limit case:

Work Unit Averaging

80% Power Limit: Average PPD Calculation over Six Days

The only outliers I tossed was one day when my production was messed up by thunderstorms (unplug your computers if there is lighting!), plus one of the days at the 60% power setting, where for some reason the card did almost 900K PPD (probably got a string of high value work units). Other than that the data was not massaged.

I tested the card at 100% power target, then at 80%, 70%, 60%, and 50% (90% did not result in any differences vs 100% because folding doesn’t max out the graphics card, so essentially it was folding at around 85% of the card’s power limit even when set to 90% or 100%).

FAH 1080 Power Target Example

Setting the Power Limit in MSI Afterburner

I left the core clock boost setting the same as my final test value from the first part of this review (+175 MHz). Note that this won’t force the card to run at a set faster speed…the power limit constantly being hit causes the core clock to drop. I had to reduce the power limit to 80% to start seeing an effect on the core clock. Further reductions in power limit show further reductions in clock rate, as expected. The approximate relationship between power limit and core clock was this:

Core Clock vs Power Limit

GTX 1080 Core Clock vs. Power Limit

Results

As expected, the card’s raw performance (measured in Points Per Day) drops off as the power target is lowered.

GTX 1080 Performance Part 2

Folding@Home Performance


The system power consumption plot is also very interesting. As you can see, I’ve shaved a good amount of power draw off of this build by downclocking the card via the power limit. GTX 1080 Power Consumption


By far, the most interesting result is what happens to the efficiency. Basically, I found that efficiency increases (to a point) with decreasing power limit. I got the best system efficiency I’ve ever seen with this card set to 60% power limit (50% power limit essentially produced the same result).

GTX 1080 Efficiency Part 2

Folding@Home Efficiency

Conclusion

For NVIDIA’s Geforce GTX 1080, decreasing a graphic’s card’s power limit can actually improve the efficiency of the card for doing computational computing in Folding@Home. This is similar to what I found when reviewing the 1060. My recommended setting for the 1080 is a power limit of 60%, because that provides a system efficiency of nearly 3500 PPD/Watt and maintains a raw performance of almost 700K PPD.


NVIDIA GEFORCE GTX 1080 Folding@Home Review (Part 1)

Intro

It’s hard to believe that the Nvidia GTX 1080 is almost three years old now, and I’m just getting around to writing a Folding@Home review of it. In the realm of graphics cards, this thing is legendary, and only recently displaced from the enthusiast podium by Nvidia’s new RTX series of cards. The 1080 was Nvidia’s top of the line gaming graphics card (next to the Ti edition of course), and has been very popular for both GPU coin mining and cancer-curing (or at least disease research for Stanford University’s charitable distributed computing project: Folding@Home). If you’ve been following along, you know it’s that second thing that I’m interested in. The point of this review is to see just how well the GTX 1080 folds…and by well, I mean not just raw performance, but also energy efficiency.


Quick Stats Comparison

I threw together a quick table to give you an idea of where the GTX 1080 stacks up (I left the newer RTX cards and the older GTX 9-series cards off of here because I’m lazy…

Nvidia Pascal Cards

Nvidia Pascal Family GPU Comparison

As you can see, the GTX 1080 is pretty fast, eclipsed only by the GTX 1080 Ti (which also has a higher Thermal Design Power, suggesting more electricity usage). From my previous articles, we’ve seen that the more powerful cards tend to do work more efficiency, especially if they are in the same TDP bracket. So, the 1080 should be a better folder (both in PPD and PPD/Watt efficiency) than the 1070 Ti I tested last time.

Test Card: ASUS GeForce GTX 1080 Turbo

As with the 1070 Ti, I picked up a pretty boring flavor of a 1080 in the form of an Asus turbo card. These cards lack back plates (which help with circuit board rigidity and heat dissipation) and use cheap blower coolers, which suck in air from a single centrifugal fan on the underside and blow it out the back of the case (keeping the hot air from building up in the case). These are loud, and tend to run hotter than open-fan coolers, so overclocking and boost clocks are limited compared to aftermarket designs. However, like Nvidia’s own Founder’s Edition reference cards, this reference design provides a good baseline for a 1080’s minimum performance.

ASUS GeForce GTX 1080 Turbo

ASUS GeForce GTX 1080 Turbo

The new 1080 looks strikingly similar to the 1070 Ti…Asus is obviously reusing the exact same cooler since both cards have a 180 Watt TDP.

Asus GTX 1080 and 1070 Ti

Asus GTX 1080 and 1070 Ti (which one is which?)

Test Environment

Like most of my previous graphics card testing, I put this into my AMD FX-Based Test System. If you are interested in how this test machine does with CPU folding, you can read about it here. Testing was done using Stanford’s Folding@Home V7 Client (version 7.5.1) in Windows 10. Points Per Day (PPD) production was collected from Stanford’s servers. Power measurements were done with a P3 Kill A Watt Meter (taken at the wall, for a total-system power profile).

Test Setup Specs

  • Case: Raidmax Sagitta
  • CPU: AMD FX-8320e
  • Mainboard : Gigabyte GA-880GMA-USB3
  • GPU: Asus GeForce 1080 Turbo
  • Ram: 16 GB DDR3L (low voltage)
  • Power Supply: Seasonic X-650 80+ Gold
  • Drives: 1x SSD, 2 x 7200 RPM HDDs, Blu-Ray Burner
  • Fans: 1x CPU, 2 x 120 mm intake, 1 x 120 mm exhaust, 1 x 80 mm exhaust
  • OS: Win10 64 bit
  • Video Card Driver Version: 372.90

Video Card Configuration – Optimize for Performance

In my previous articles, I’ve shown how Nvidia GPUs don’t always automatically boost their clock rates when running Folding@home (as opposed to video games or benchmarks). The same is true of the GTX 1080. It sometimes needs a little encouragement in order to fold at the maximum performance. I overclocked the core by 175 MHz and increased the power limit* by 20% in MSI afterburner using similar settings to the GTX 1070. These values were shown to be stable after 2+ weeks of testing with no dropped work units.

*I also experimented with the power limit at 100% and I saw no change in card power consumption. This makes sense…folding is not using 100% of the GPU. Inspection of the MSI afterburner plots shows that while folding, the card does not hit the power limit at either 100% or 120%. I will have to reduce the power limit to get the card to throttle back (this will happen in part 2 of this article).

As with previous cards, I did not push the memory into its performance zone, but left it at the default P2 (low-power) state clock rate. The general consensus is that memory clock does not significantly affect folding@home, and it is better to leave the power headroom for the core clock, which does improve performance. As an interesting side-note, the memory clock on this thing jumps up to 5000 Mhz (effective) in benchmarks. For example, see the card’s auto-boost settings when running Heaven:

1080 Benchmark Stats

Nvidia GeForce GTX 1080 – Boost Clocks (auto) in Heaven Benchmark

Testing Overview

For most of my tests, I just let the computer run folding@home 24/7 for a couple of days and then average the points per day (PPD) results from Stanford’s stats server. Since the GTX 1080 is such a popular card, I decided to let it run a little longer (a few weeks) to get a really good sampling of results, since PPD can vary a lot from work unit to work unit. Before we get into the duration results, let’s do a quick overview of what the Folding@home environment looks like for a typical work unit.

The following is an example screen shot of the display from the client, showing an instantaneous PPD of about 770K, which is very impressive. Here, it is folding on a core 21 work unit (Project 14124).

F@H Client 1080

Folding@Home V7 Client – GeForce GTX 1080

MSI Afterburner is a handy way to monitor GPU stats. As you can see, the GPU usage is hovering in the low 80% region (this is typical for GPU folding in Windows. Linux can use a bit more of the GPU for a few percentage points more PPD). This Asus card, with its reference blower cooler, is running a bit warm (just shy of 70 degrees C), but that’s well within spec. I had the power limit at 120%, but the card is nowhere near hitting that…the power limit seems to just peak above 80% here and there.

GTX 1080 MSI Afterburner

GTX 1080 stats while folding.

Measuring card power consumption with the driver shows that it’s using about 150 watts, which seems about right when compared to the GPU usage and power % graphs. 100% GPU usage would be ideal (and would result in a power consumption of about 180 watts, which is the 1080’s TDP).

In terms of card-level efficiency, this is 770,000 PPD / 150 Watts = 5133 PPD/Watt.

Power Draw (at the card)

Nvidia Geforce GTX 1080 – Instantaneous Power Draw @ the Card

Duration Testing

I ran Folding@Home for quite a while on the 1080. As you can see from this plot (courtesy of https://folding.extremeoverclocking.com/), the 1080 is mildly beating the 1070 Ti. It should be noted that the stats for the 1070 Ti are a bit low in the left-hand side of the plot, because folding was interrupted a few times for various reasons (gaming). The 1080 results were uninterrupted.

1080 Production History

Geforce GTX 1080 Production History

Another thing I noticed was the amount of variation in the results. Normal work unit variation (at least for less powerful cards) is around 10-20 percent. For the GTX 1080, I saw swings of 200K PPD, which is closer to 30%. Check out that one point at 875K PPD!

Average PPD: 730K PPD

I averaged the PPD over two weeks on the GTX 1080 and got 730K PPD. Previous testing on the GTX 1070 Ti (based on continual testing without interruptions) showed an average PPD of 700K. Here is the plot from that article, reproduced for convenience.

Nvidia GTX 1070 Ti Time History

Nvidia GTX 1070 Ti Folding@Home Production Time History

I had expected my GTX 1080 to do a bit better than that. However, it only has about 5% more CUDA cores than the GTX 1070 Ti (2560 vs 2438). The GTX 1080’s faster memory also isn’t an advantage in Folding@Home. So, a 30K PPD improvement for the 1080, which corresponds to about a 4.3% faster, makes sense.

System Average Power Consumption: 240 Watts @ the Wall

I spot checked the power meter (P3 Kill A Watt) many times over the course of folding. Although it varies with work unit, it seemed to most commonly use around 230 watts. Peek observed wattage was 257, and minimum was around 220. This was more variation than I typically see, but I think it corresponds with the variation in PPD I saw in the performance graph. It was very tempting to just say that 230 watts was the number, but I wasn’t confident that this was accurate. There was just too much variation.

In order to get a better number, I reset the Kill-A-Watt meter (I hadn’t reset it in ages) and let it log the computer’s usage over the weekend. The meter keeps track of the total kilowatt-hours (KWH) of energy consumed, as well as the time period (in hours) of the reading. By dividing the energy by time, we get power. Instead of an instantaneous power (the eyeball method), this is an average power over the weekend, and is thus a compatible number with the average PPD.

The end result of this was 17.39 KWH consumed over 72.5 hours. Thus, the average power consumption of the computer is:

17.39/72.5 (KWH/H) * 1000 (Watts/KW) = about 240 Watts (I round a bit for convenience in reporting, but the Excel sheet that backs up all my plots is exact)

This is a bit more power consumed than the GTX 1070 Ti results, which used an average of 225 watts (admittedly computed by the eyeball method over many days, but there was much less variation so I think it is valid). This increased power consumption of the GTX 1080 vs. the 1070 Ti is also consistent with what people have seen in games. This Legit Reviews article shows an EVGA 1080 using about 30 watts more power than an EVGA 1070 Ti during gaming benchmarks. The power consumption figure is reproduced below:

LegitReviews_power-consumption

Modern Graphics Card Power Consumption. Source: Legit Reviews

This is a very interesting result. Even though the 1080 and the 1070 Ti have the same 180 Watt TDP, the 1080 draws more power, both in folding@home and in gaming.

System Computational Efficiency: 3044 PPD/Watt

For my Asus GeForce GTX 1080, the folding@home efficiency is:

730,000 PPD / 240 Watts = 3044 PPD/Watt.

This is an excellent score. Surprisingly, it is slightly less than my Asus 1070 Ti, which I found to have an efficiency of 3126 PPD/Watt. In practice these are so close that it just could be attributed to work unit variation. The GeForce 1080 and 1070 Ti are both extremely efficient cards, and are good choices for folding@home.

Comparison plots here:

GeForce 1080 PPD Comparison

GeForce GTX 1080 Folding@Home PPD Comparison

GeForce 1080 Efficiency Comparison

GeForce GTX 1080 Folding@Home Efficiency Comparison

Final Thoughts

The GTX 1080 is a great card. With that said, I’m a bit annoyed that my GTX 1080 didn’t hit 800K PPD like some folks in the forums say theirs do (I bet a lot of those people getting 800K PPD use Linux, as it is a bit better than Windows for folding). Still, this is a good result.

Similarly, I’m annoyed that the GTX 1080 didn’t thoroughly beat my 1070 Ti in terms of efficiency. The results are so close though that it’s effectively the same. This is part one of a multi-part review, where I tuned the card for performance. In the next article, I plan to go after finding a better efficiency point for running this card by experimenting with reducing the power limit. Right now I’m thinking of running the card at 80% power limit for a week, and then at 60% for another week, and reporting the results. So, stay tuned!