Tag Archives: Points Per Day

New Folding@Home Benchmark Machine: It’s RYZEN TIME!

Folding@Home, the distributed computing project that fights diseases such as COVID-19 and cancer, has hit an all-time high in popularity. I’m stunned to find that my blog is now getting more views every day than it did every month last year. With that said, this is a perfect opportunity to reach out and see if all the new donors are interested in tuning their computers for efficiency, to save a little on power, lighten the burden on your wallet, and hopefully produce nearly the same amount of science. If this sounds interesting to you, let me know in the comments below!

In my last post, I noted that the latest generation of graphics cards are starting to push the limits of what my primary GPU Folding@Home benchmark rig can do. That computer is based on an 11-year-old chipset (AMD 880), and only supports PCI-Express 2.0. In order for me to keep testing modern fast graphics cards in Windows 10, I wanted to make sure that PCI-Express slot bandwidth wasn’t going to artificially bottleneck me.

So, without further ado, let me present the new, re-built Folding@Home rig, SAGITTA:

Sagitta Desktop

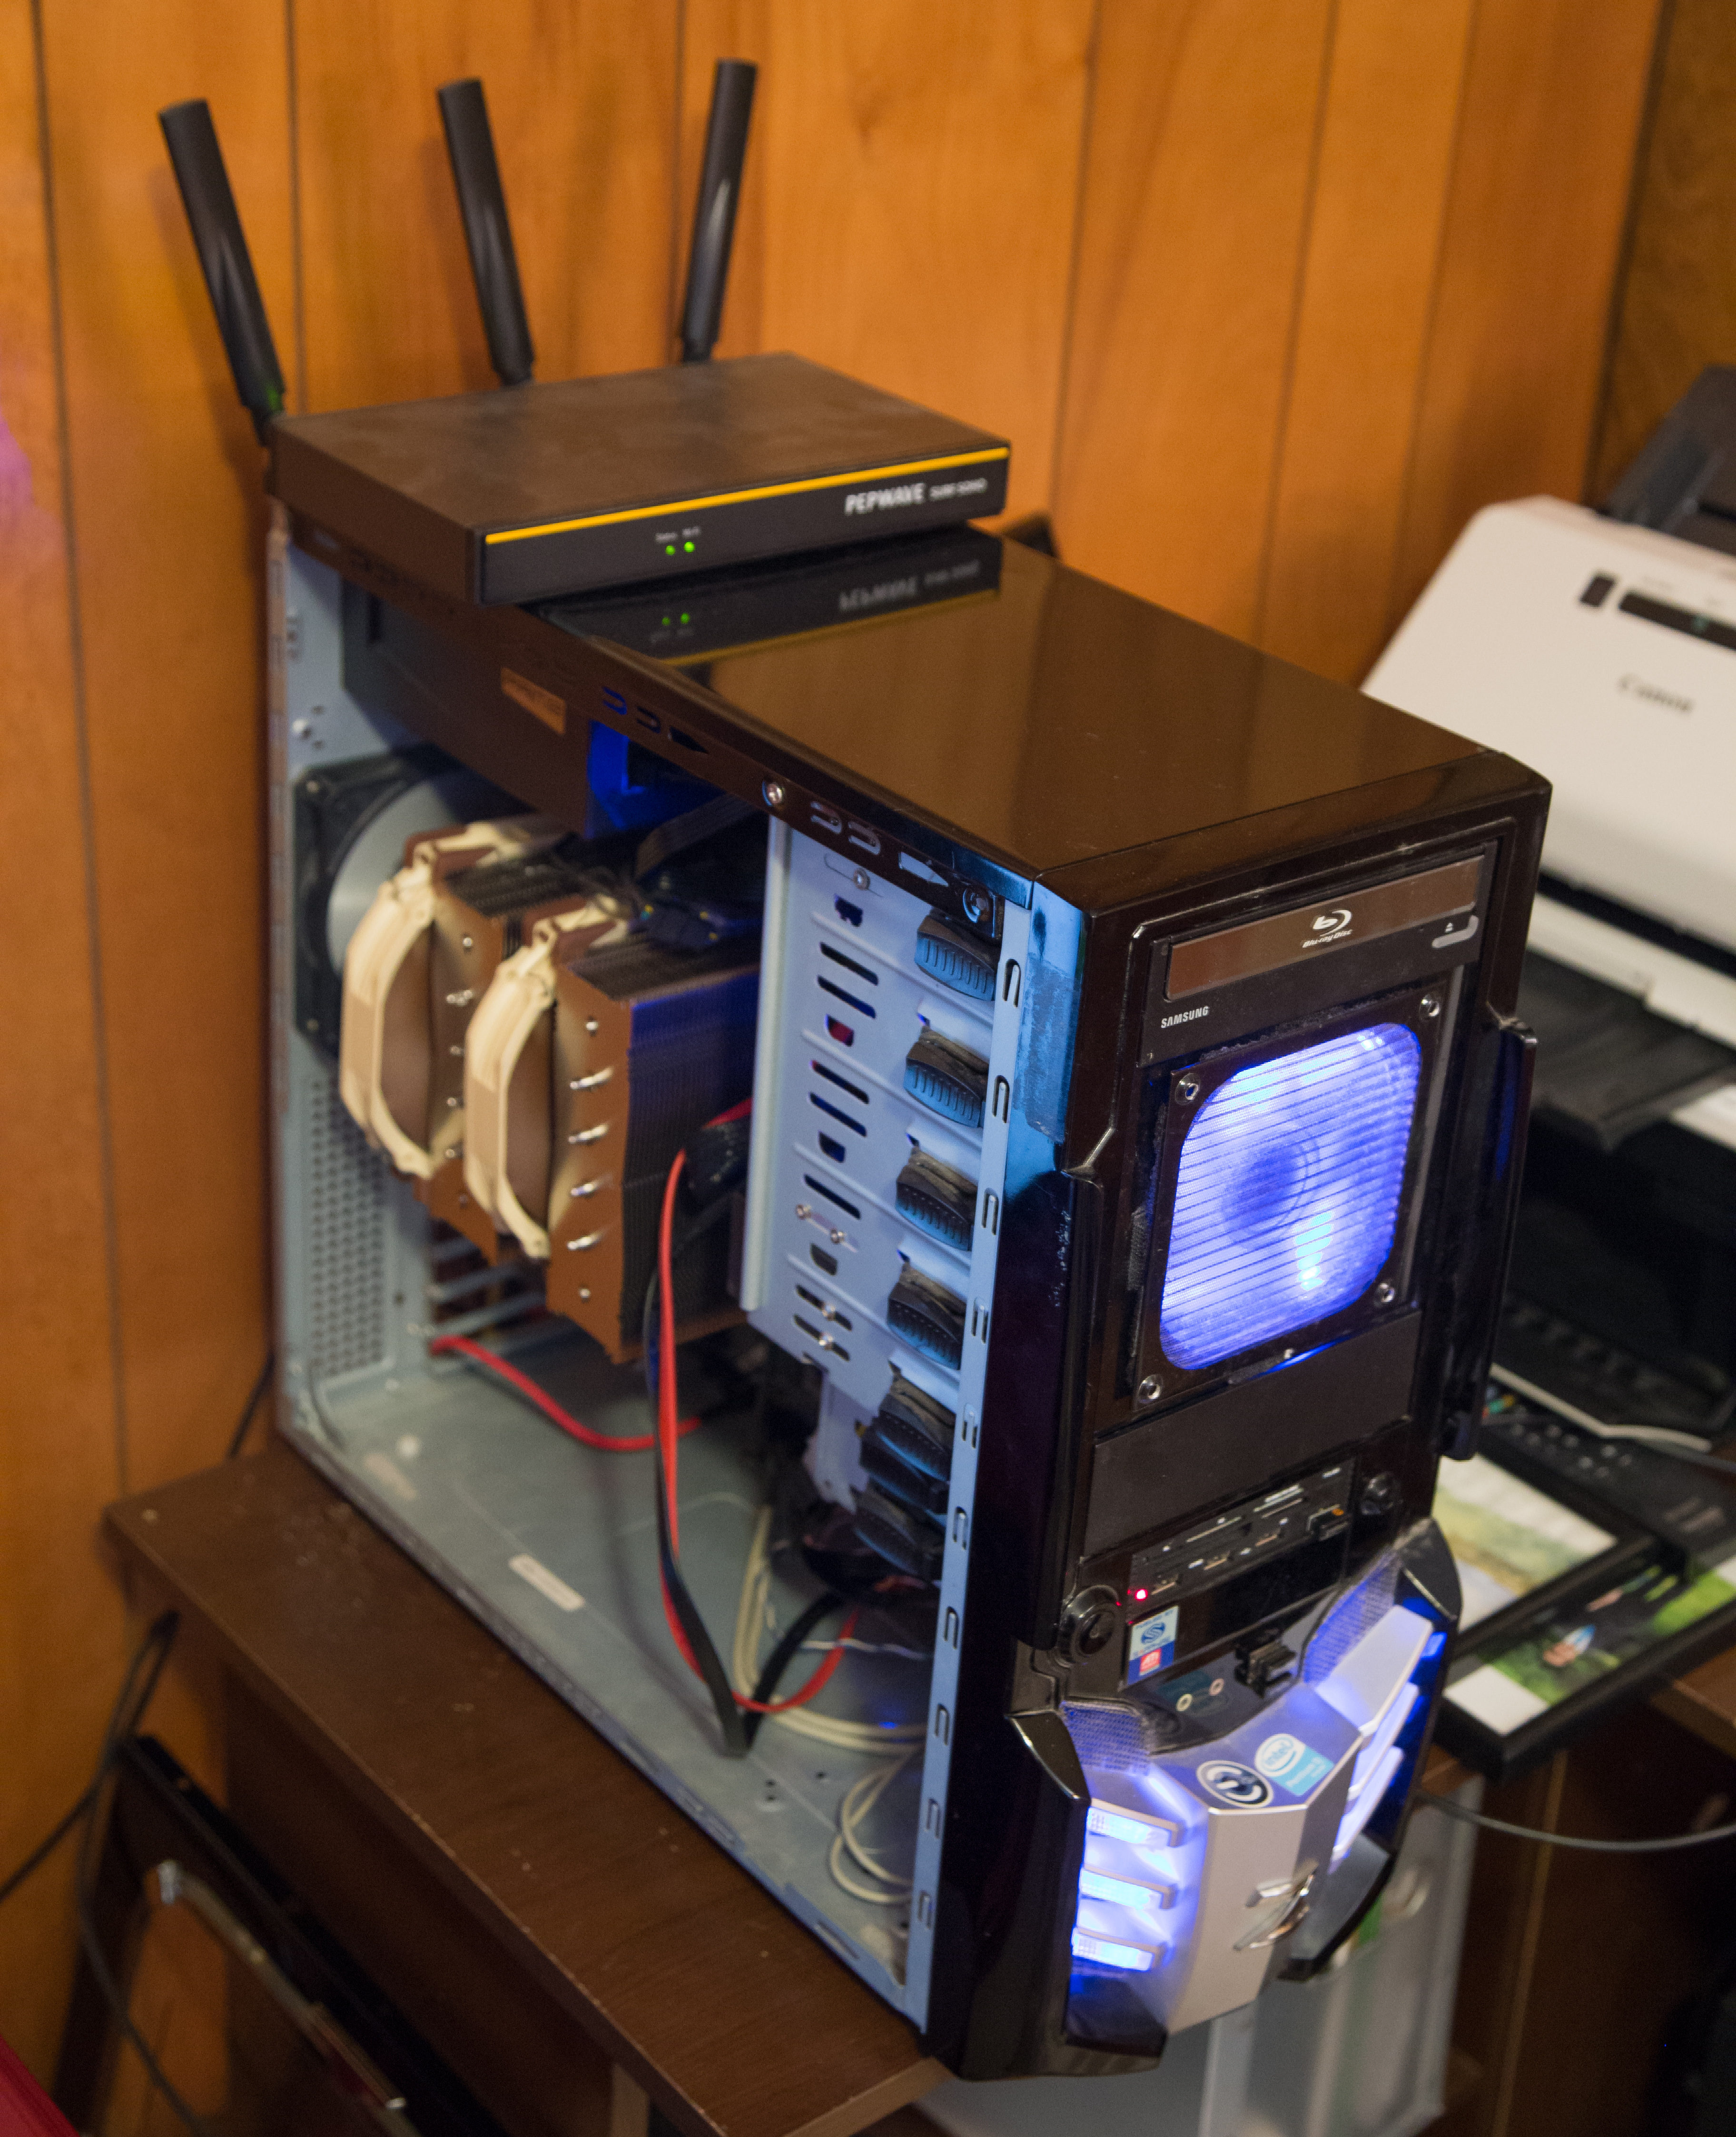
I’ve (re)created a monster!

This build leverages the Raidmax Sagitta case that I’ve had since 2006. This machine has hosted multiple builds (Pentium D 805, Core 2 Duo e8600, Core 2 Quad Q6600, Phenom II X6 1100T, and the most recent FX-8320e Bulldozer). There have been too many graphics cards to count, but the latest one (Nvidia GTX 1650 by Zotac) was carried over for some continuity testing. The case fans and power supply (initially) were also the same since the previous FX build (they aren’t the same ones from back in 2006…those got loud and died long ago). I also kept my Blu-Ray drive and 3.5 inch card reader. That’s where the similarities end. Here is a specs comparison:

Sagitta Rebuild Benchmark Machine Specs

  • Note I ended up updating the power supply to the one shown in the table. More on that below…

System Power Consumption

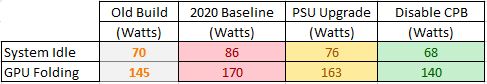
Initially, the power consumption at idle of the new Ryzen 9 build, measured with my P3 Kill A Watt Meter, was 86 watts. The power consumption while running GPU Folding was 170 watts (and the all-core CPU folding was over 250 watts, but that’s another article entirely).

Using the same Nvidia GeForce GTX 1650 graphics card, these idle and GPU folding power numbers were unfortunately higher than the old benchmark machine, which came in at 70 watts idle and 145 watts load. This is likely due to the overkill hardware that I put into the new rig (X570 motherboards alone are known to draw twice the power of a more normal board). The system’s power consumption difference of 25 watts while folding was especially problematic for my efficiency testing, since new plots compared to graphics cards tested on the old benchmark machine would not be comparable.

To solve this, I could either:

A: Use a 25 watt offset to scale the new GPU F@H efficiency plots

B: Do nothing and just have less accurate efficiency comparisons to previous tests

C: Reduce the power consumption of the new build so that it matches the old one

This being a blog about energy efficiency, I decided to go with Option C, since that’s the one that actually helps the environment. Lets see if we can trim the fat off of this beast of a computer!

Efficiency Boost #1: Power Supply Upgrade

The first thing I tried was to upgrade the power supply. As noted here, the power supply’s efficiency rating is a great place to start when building an energy efficient machine. My old Seasonic X-650 is a very good power supply, and caries an 80+ Gold rating. Still, things have come a long way, and switching to an 80+ Titanium PSU can gain a few efficiency percentage points, especially at low loads.

80+ Table

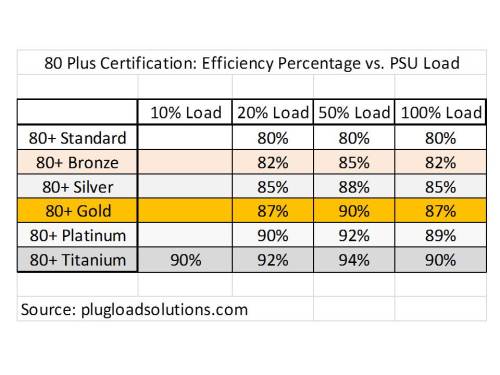
80+ Efficiency Table

With that 3-5% efficiency boost in mind, I picked up a new Seasonic 750 Watt Prime 80+ Titanium modular power supply. At $200, this PSU isn’t cheap, but it provides a noticeable efficiency improvement at both idle and load. Other nice features were the additional 100 watts of capacity, and the fact that it supported my new motherboard’s dual pin (8 + 4) CPU aux power connection. That extra 4-pin isn’t required to make the X570 board work, but it does allow for more overclocking headroom.

Disclaimer: Before we get into it, I should note that these power readings are “eyeball” readings, taken by glancing at the watt meter and trying to judge the average usage. The actual number jumps around a bit (even at idle) as the computer executes various background tasks. I’d say the measurement precision on any eyeball watt meter readings is +/- 5 watts, so take the below with a grain of salt. These are very small efficiency improvements that are difficult to measure, and your mileage may vary. 

After upgrading the power supply, idle power dropped an impressive 10 watts, from 86 watts to 76. This is an awesome 11% efficiency improvement. This might be due to the new 80+ Titanium power supply having an efficiency target at very low loads (90% efficiency at 10% load), whereas the old 80+ Gold spec did not have a low load efficiency requirement. Thus, even though I used a large 750 watt power supply, the machine can still remain relatively efficient at idle.

Under moderate load (GPU folding), the new 80+ titanium PSU provided a 4% efficiency improvement, dropping the power consumption from 170 watts to 163. This is more in line with expectations.

Efficiency Boost #2: Processor Underclock / Undervolt

Thanks to video gaming mentality, enthusiast-grade desktop processors and motherboards are tuned out of the box for performance. We’re talking about blistering fast, competition-crushing benchmark scores. For most computing tasks (such as running Folding@Home on a graphics card), this aggressive CPU behavior is wasting electricity while offering no discernible performance benefit. Despite what my kid’s shirt says, we need to reel these power hungry CPUs in for maximum GPU folding efficiency.

Never Slow Down

Kai Says: Never Slow Down

One way to improve processor efficiency is to reduce the clock rate and associated voltage. I’d previously investigated this here. It takes exponentially more voltage to support high frequencies, so just by dropping the clock rate by 100 MHz or so, you can lower the voltage a bunch and save on power.

With the advent of processors that up-clock and up-volt themselves (as well as going in the other direction), manual tuning can be a bit more difficult. It’s far easier to first try the automatic settings, to see if some efficiency can be gained.

But wait, this is a GPU folding benchmark rig? Why does the CPU’s frequency and power settings matter?

For GPU folding with an Nvidia graphics card, one CPU core is fully loaded per GPU slot in order to “feed” the card. This is because Nvidia’s implementation of open CL support using a polling (checking) method. In order to keep the graphics card chugging along, the CPU constantly checks on the GPU to see if it needs any data. This polling loop is not efficient and burns unnecessary power. You can read more about it here: https://foldingforum.org/viewtopic.php?f=80&t=34023. In contrast, AMD’s method (interrupts) is a much more graceful implementation that doesn’t lock up a CPU core.

The constant polling loop drives modern gaming-oriented processors to clock up their cores unnecessarily. For the most part, the GPU does not need work at every waking moment. To save power, we can turn down the frequency, so that the CPU is not constantly knocking on the GPU’s metaphorical door.

To do this, I disabled AMD’s Core Performance Boost (CPB) in the AMD Overclocking section of the BIOS (same thing as Intel’s Turbo Boost). This caps the processor speed at the base maximum clock rate (3.5 GHz for the Ryzen 9 3950x), and also eliminates any high voltage values required to support the boost clocks.

Success! GPU folding total system power consumption is now much lower. With less superfluous power draw from the CPU, the wattage is much more comparable to the old Bulldozer rig.

Ryzen 9 3950x Power Reduction Table

It is interesting that idle power consumption came down as well. That wasn’t expected. When the computer isn’t doing anything, the CPU cores should be down-clocked / slept out. Perhaps my machine was doing something in the background during the earlier tests, thus throwing the results off. More investigation is needed.

GPU Benchmark Consistency Check

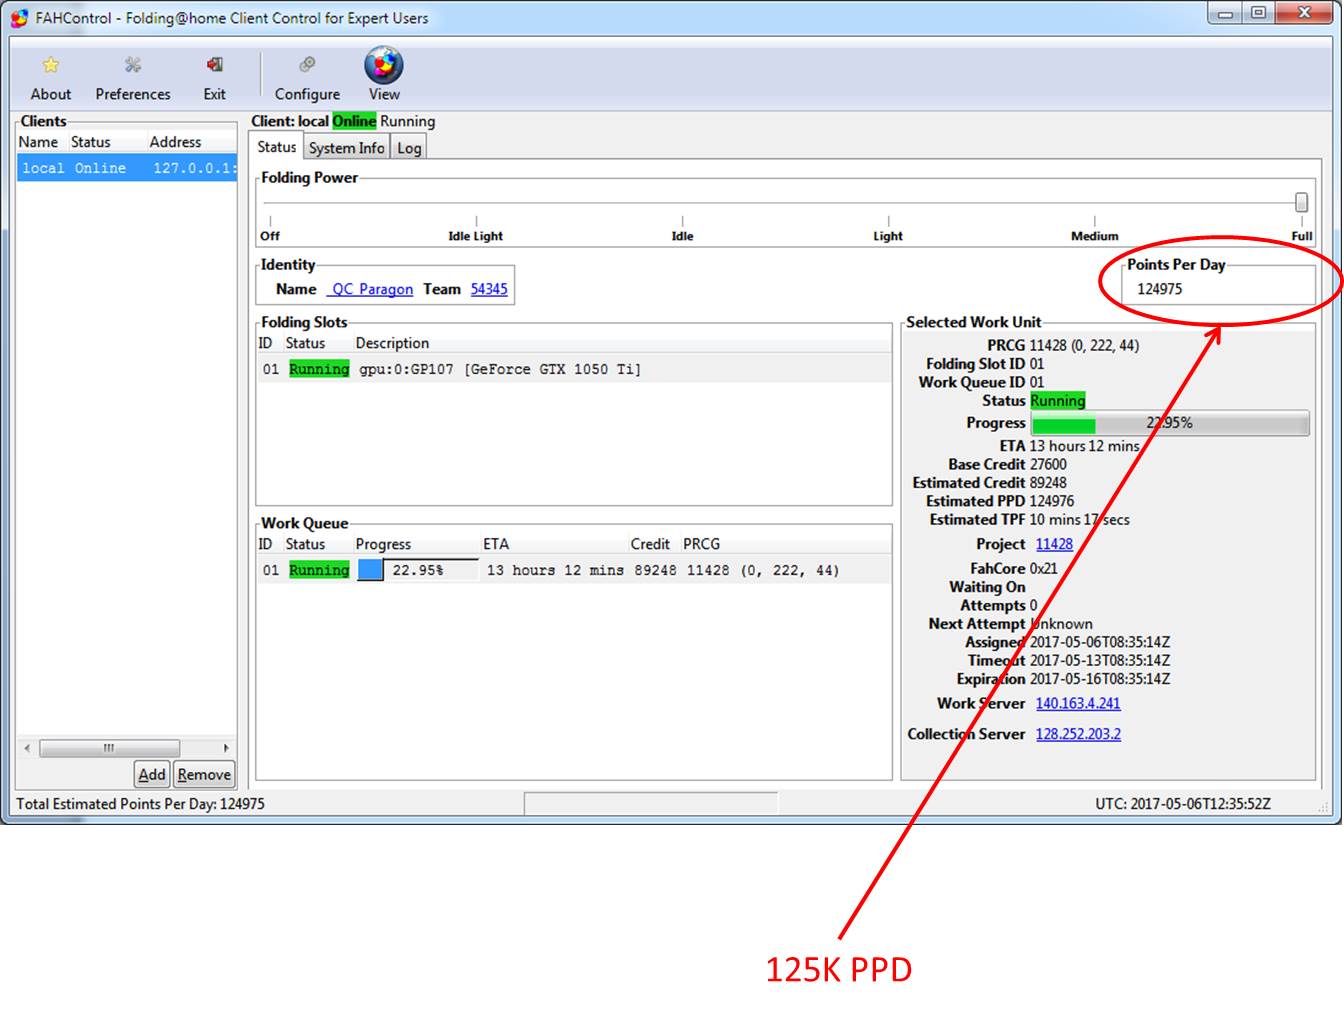
I fired up GPU folding on the Nvidia GeForce GTX 1650, a card that I have performance data for from my previous benchmark desktop. After monitoring it for a week, the Folding@Home Points Per Day performance was so similar to the previous results that I ended up using the same value (310K PPD) as the official estimate for the 1650’s production. This shows that the old benchmark rig was not a bottleneck for a budget card like the GeForce GTX 1650.

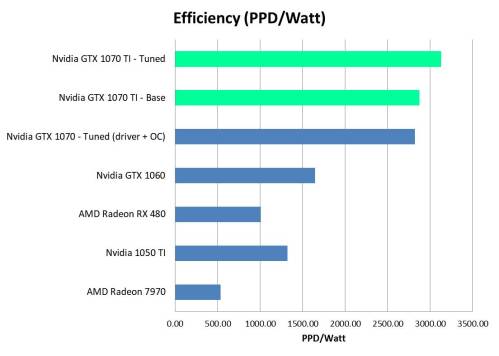
Using the updated system power consumption of nominally 140 watts (vs 145 watts of the previous benchmark machine), the efficiency plots (PPD/Watt) come out very nearly the same. I typically consider power measurements of + / – 5 watts to be within the measurement accuracy of my eyeball on the watt meter anyway, due to normal variations as the system runs. The good news is that even with this variation, it doesn’t change the conclusion of the figure (in terms of graphics card efficiency ranking).

GTX 1650 Efficiency on Ryzen 9

* Benchmark performed on updated Ryzen 9 build

Conclusion

I have a new 16-core beast of a benchmark machine. This computer wasn’t built exclusively for efficiency, but after a few tweaks, I was able to improve energy efficiency at low CPU loads (such as Windows Idle + GPU Folding).

For most of the graphics cards I have tested so far, the massive upgrade in system hardware will not likely affect performance or efficiency results. Very fast cards, such as the 1080 Ti, might benefit from the new benchmark rig’s faster hardware, especially that PCI-Express 4.0 x16 graphics card slot. Most importantly, future tests of blistering fast graphics cards (2080 Ti, 3080 Ti, etc) will probably not be limited by the benchmark machine’s background hardware.

Oh, I can also now encode my backup copies of my blu-ray movies at 40 fps in H.265 in Handbrake (old speed was 6.5 fps on the FX-8320e). That’s a nice bonus too.

Efficiency Note (for GPU Folding@Home Users)

Disabling the automatic processor frequency and voltage scaling (Turbo Boost / Core Performance Boost) didn’t have any effect on the PPD being generated by the graphics card. This makes sense; even relatively slow 2.0 GHz CPU cores are still fast enough to feed most GPUs, and my modern Ryzen 9 at 3.5 GHz is no bottleneck for feeding the 1650. By disabling CPB, I shaved 23 watts off of the system’s power consumption for literally no performance impact while running GPU folding. This is a 16 percent boost in PPD/Watt efficiency, for free!

This also dropped CPU temps from 70 degrees C to 55, and resulted in a lower CPU cooler fan speed / quieter machine. This should promote longevity of the hardware, and reduce how much my computer fights my air conditioning in the summer, thus having a compounding positive effect on my monthly electric bill.

Future Articles

  • Re-Test the 1080 Ti to see if a fast graphics card makes better use of the faster PCI-Express bus on the AM4 build
  • Investigate CPU folding efficiency on the Ryzen 9 3950x


Shout out to the helpers…Kai and Sam

Advertisement

Nvidia GeForce GTX 1070 Ti Folding@Home Review

In an effort to make as much use of the colder months in New England as I can, I’m running tons of Stanford University’s Folding@Home on my computer to do charitable science for disease research while heating my house. In the last article, I reviewed a slightly older AMD card, the RX 480, to determine its performance and efficiency running Folding@Home. Today, I’ll be taking a look at one of the favorite cards from Nvidia for both folding and gaming: The 1070 Ti.

The GeForce GTX 1070 Ti was released in November 2017, and sits between the 1070 and 1080 in terms of raw performance. As of February 2019, the 1070 Ti can be for a deep discount on the used market, now that the RTX 20xx series cards have been released. I got my Asus version on eBay for $250.

Based on Nvidia’s 14nm Pascal architecture, the 1070 Ti has 2432 CUDA cores and 8 GB of GDDR5 memory, with a memory bandwidth of 256 GB/s. The base clock rate of the GPU is 1607 MHz, although the cards automatically boost well past the advertised boost clock of 1683 Mhz. Thermal Design Power (TDP) is 180 Watts.

The 3rd party Asus card I got is nothing special. It appears to be a dual-slot reference design, and uses a blower cooler to exhaust hot air out the back of the case. It requires one supplemental 8-pin PCI-E Power connection.

IMG_20190206_185514342

ASUS GeForce GTX 1070 Ti

One thing I will note about this card is it’s length. At 10.5 inches (which is similar to many NVidia high-end cards), it can be a bit problematic to fit in some cases. I have a Raidmax Sagitta mid-tower case from way back in 2006, and it fits, but barely. I had the same problem with the EVGA GeForce 1070 I reviewed earlier.

IMG_20190206_190210910_TOP

ASUS GTX 1070 Ti – Installed.

Test Environment

Testing was done in Windows 10 on my AMD FX-based system, which is old but holds pretty well, all things considered. You can read more on that here. The system was built for both performance and efficiency, using AMD’s 8320e processor (a bit less power hungry than the other 8-core FX processors), a Seasonic 650 80+ Gold Power Supply, and 8 GB of low voltage DDR3 memory. The real key here, since I take all my power measurements at the wall with a P3 Kill-A-Watt meter, is that the system is the same for all of my tests.

The Folding@Home Client version is 7.5.1, running a single GPU slot with the following settings:

GPU Slot Options

GPU Slot Options for Maximum PPD

These settings tend to result in a slighter higher points per day (PPD), because they request large, advanced work units from Stanford.

Initial Test Results

Initial testing was done on one of the oldest drivers I could find to support the 1070 Ti (driver version 388.13). The thought here was that older drivers would have less gaming optimizations, which tend to hurt performance for compute jobs (unlike AMD, Nvidia doesn’t include a compute mode in their graphics driver settings).

Unfortunately, the best Nvidia driver for the non-Ti GTX 10xx cards (372.90) doesn’t work with the 1070 Ti, because the Ti version came out a few months later than the original cards. So, I was stuck with version 388.13.

Nvidia 1070 TI Baseline Clocks

Nvidia GTX 1070 Ti Monitoring – Baseline Clocks

I ran F@H for three days using the stock clock rate of 1823 MHz core, with the memory at 3802 MHz. Similar to what I found when testing the 1070, Folding@Home does not trigger the card to go into the high power (max performance) P0 state. Instead, it is stuck in the power-saving P2 state, so the core and memory clocks do not boost.

The PPD average for three days when folding at this rate was 632,380 PPD. Checking the Kill-A-Watt meter over the course of those days showed an approximate average system power consumption of 220 watts. Interestingly, this is less power draw than the GTX 1070 (which used 227 watts, although that was with overclocking + the more efficient 372.90 driver). The PPD average was also less than the GTX 1070, which had done about 640,000 PPD. Initial efficiency, in PPD/Watt, was thus 2875 (compared to the GTX 1070’s 2820 PPD/Watt).

The lower power consumption number and lower PPD performance score were a bit surprising, since the GTX 1070 TI has 512 more CUDA cores than the GTX 1070. However, in my previous review of the 1070, I had done a lot of optimization work, both with overclocking and with driver tuning. So, now it was time to do the same to the 1070 Ti.

Tuning the Card

By running UNIGINE’s Heaven video game benchmark in windowed mode, I was able to watch what the card did in MSI afterburner. The core clock boosted up to 1860 MHz (a modest increase from the 1823 base clock), and the memory went up to 4000 MHz (the default). I tried these overclocking settings and saw only a modest increase in PPD numbers. So, I decided to push it further, despite the Asus card having only a reference-style blower cooler. From my 1070 review, I found I was able to fold nice and stable with a core clock of 2012 MHz and a memory clock of 3802 MHz. So, I set up the GTX 1070 Ti with those same settings. After running it for five days, I pushed the core a little higher to 2050 Mhz. A few days later, I upgraded the driver to the latest (417.71).

Nvidia 1070 TI OC

Nvidia GTX 1070 Ti Monitoring – Overclocked

With these settings, I did have to increase the fan speed to keep the card below 70 degrees Celsius. Since the Asus card uses a blower cooler, it was a bit loud, but nothing too crazy. Open-air coolers with lots of heat pipes and multiple fans would probably let me push the card higher, but from what I’d read, people start running into stability problems at core clocks over 2100 Mhz. Since the goal of Folding@home is to produce reliable science to help Stanford University fight disease, I didn’t want to risk dropping a work unit due to an unstable overclock.

Here’s the production vs. time history from Stanford’s servers, courtesy of https://folding.extremeoverclocking.com/

Nvidia GTX 1070 Ti Time History

Nvidia GTX1070 Ti Folding@Home Production Time History

As you can see below, the overclock helped improve the performance of the GTX 1070 Ti. Using the last five days worth of data points (which has the graphics driver set to 417.71 and the 2050 MHz core overclock), I got an average PPD of 703,371 PPD with a power consumption at the wall of 225 Watts. This gives an overall system efficiency of 3126 PPD/Watt.

Finally, these results are starting to make more sense. Now, this card is outpacing the GTX 1070 in terms of both PPD and energy efficiency. However, the gain in performance isn’t enough to confidently say the card is doing better, since there is typically a +/- 10% PPD difference depending on what work unit the computer receives. This is clear from the amount of variability, or “hash”, in the time history plot.

Interestingly, the GTX 1070 Ti it is still using about the same amount of power as the base model GTX 1070, which has a Thermal Design Power of 150 Watts, compared to the GTX 1070 Ti’s TDP of 180 Watts. So, why isn’t my system consuming 30 watts more at the wall than it did when equipped with the base 1070?

I suspect the issue here is that the drivers available for the 1070 Ti are not as good for folding as the 372.90 driver for the non-Ti 10-series Nvidia cards. As you can see from the MSI Afterburner screen shots above, GPU Usage on the GTX 1070 Ti during folding hovers in the 80-90% range, which is lower than the 85-93% range seen when using the non-Ti GTX 1070. In short, folding on the 1070 Ti seems to be a bit handicapped by the drivers available in Windows.

Comparison to Similar Cards

Here are the Production and Efficiency Plots for comparison to other cards I’ve tested.

GTX 1070 Ti Performance Comparison

GTX 1070 Ti Performance Comparison

GTX 1070 Ti Efficiency Comparison

GTX 1070 Ti Efficiency Comparison

Conclusion

The Nvidia GTX 1070 Ti is a very good graphics card for running Folding@Home. With an average PPD of 703K and a system efficiency of 3126 PPD/Watt, it is the fastest and most efficient graphics card I’ve tested so far. As far as maximizing the amount of science done per electricity consumed, this card continues the trend…higher-end video cards are more efficient, despite the increased power draw.

One side note about the GTX 1070 Ti is that the drivers don’t seem as optimized as they could be. This is a known problem for running Folding@Home in Windows. But, since the proven Nvidia driver 372.90 is not available for the Ti-flavor of the 1070, the hit here is more than normal. On the used market in 2019, you can get a GTX 1070 for $200 on ebay, whereas the GTX 1070 Ti’s go for $250. My opinion is that if you’re going to fold in Windows, a tuned GTX 1070 running the 372.90 driver is the way to go.

Future Work

To fully unlock the capability of the GTX 1070 Ti, I realized I’m going to have to switch operating systems. Stay tuned for a follow-up article in Linux.

Folding@Home on the Nvidia GeForce GTX 1050 TI: Extended Testing

Hi again.  Last week, I looked at the performance and energy efficiency of using an Nvidia GeForce GTX 1050 TI to run Stanford’s charitable distributed computing project Folding@home.  The conclusion of that study was that the GTX 1050 TI offers very good Points Per Day (PPD) and PPD/Watt energy efficiency.  Now, after some more dedicated testing, I have a few more thoughts on this card.

Average Points Per Day

In the last article, I based the production and efficiency numbers on the estimated completion time of one work unit (Core 21), which resulted in a PPD of 192,000 and an efficiency of 1377 PPD/Watt.  To get a better number, I let the card complete four work units and report the results to Stanford’s collection server.  The end result was a real-world performance of 185K PPD and 1322 PPD/Watt (power consumption is unchanged at 140 watts @ the wall).  These are still very good numbers, and I’ve updated the charts accordingly.  It should be noted that this still only represents one day of folding, and I am suspicious that this PPD is still on the high end of what this card should produce as an average.  Thus, after this article is complete, I’ll be running some more work units to try and get a better average.

Folding While Doing Other Things

Unlike the AMD Radeon HD 7970 reviewed here, the Nvidia GTX 1050 TI doesn’t like folding while you do anything else on the machine.  To use the computer, we ended up pausing folding on multiple occasions to watch videos and browse the internet.  This results in a pretty big hit in the amount of disease-fighting science you can do, and it is evident in the PPD results.

Folding on a Reduced Power Setting

Finally, we went back to uninterrupted folding on the card, but at a reduced power setting (90%, set using MSI Afterburner).  This resulted in a 7 watt reduction of power consumption as measured at the wall (133 watts vs. 140 watts).  However, in order to produce this reduction in power, the graphics card’s clock speed is reduced, resulting in more than a performance hit.  The power settings can be seen here:

GTX 1050 Throttled

MSI Afterburner is used to reduce GPU Power Limit

Observing the estimated Folding@home PPD in the Windows V7 client shows what appears to be a massive reduction in PPD compared to previous testing.  However, since production is highly dependent on the individual projects and work units, this reduction in PPD should be taken with a grain of salt.

GTX 1050 V7 Throttled Performance

In order to get some more accurate results at the reduced power limit, we let the machine chug along uninterrupted for a week.  Here is the PPD production graph courtesy of http://folding.extremeoverclocking.com/

GTX 1050 Extended Performance Testing

Nvidia GTX 1050 TI Folding@Home Extended Performance Testing

It appears here that the 90% power setting has caused a significant reduction in PPD. However, this is based on having only one day’s worth of results (4 work units) for the 100% power case, as opposed to 19 work units worth of data for the 90% power case. More testing at 100% power should provide a better comparison.

Updated Charts (pending further baseline testing)

GTX 1050 PPD Underpowered

Nvidia GTX 1050 PPD Chart

GTX 1050 Efficiency Underpowered

Nvidia GTX 1050 TI Efficiency

As expected, you can contribute the most to Stanford’s Folding@home scientific disease research with a dedicated computer.  Pausing F@H to do other tasks, even for short periods, significantly reduces performance and efficiency.  Initial results seem to indicate that reducing the power limit of the graphics card significantly hurts performance and efficiency.  However, there still isn’t enough data to provide a detailed comparison, since the initial PPD numbers I tested on the GTX 1050 were based on the results of only 4 completed work units.  Further testing should help characterize the difference.