Overview
Folding@home is Stanford University’s charitable distributed computing project. It’s charitable because you can donate electricity, as converted into work through your home computer, to fight cancer, Alzheimer’s, and a host of other diseases. It’s distributed, because anyone can run it with almost any desktop PC hardware. But, not all hardware configurations are created equally. If you’ve been following along, you know the point of this blog is to do the most work for as little power consumption as possible. After all, electricity isn’t free, and killing the planet to cure cancer isn’t a very good trade-off.
Today we’re testing out Folding@home on an EVGA NVIDIA GTX 1070 graphics card. This card offers a big step up in gaming and compute horsepower compared to the 1060 I reviewed previously, and is capable of pushing solid frame rates at 4K resolution. So, how well does it fold?
Card Specifications (Nvidia Reference Specs)
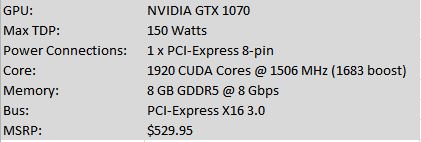
Nvidia GTX 1070 Specifications
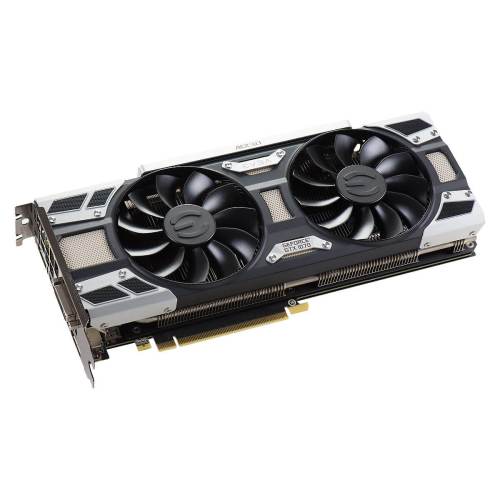
EVGA Nvidia GTX 1070 ACX 3.0 (photo credit: EVGA)
FOLDING@HOME TEST SETUP
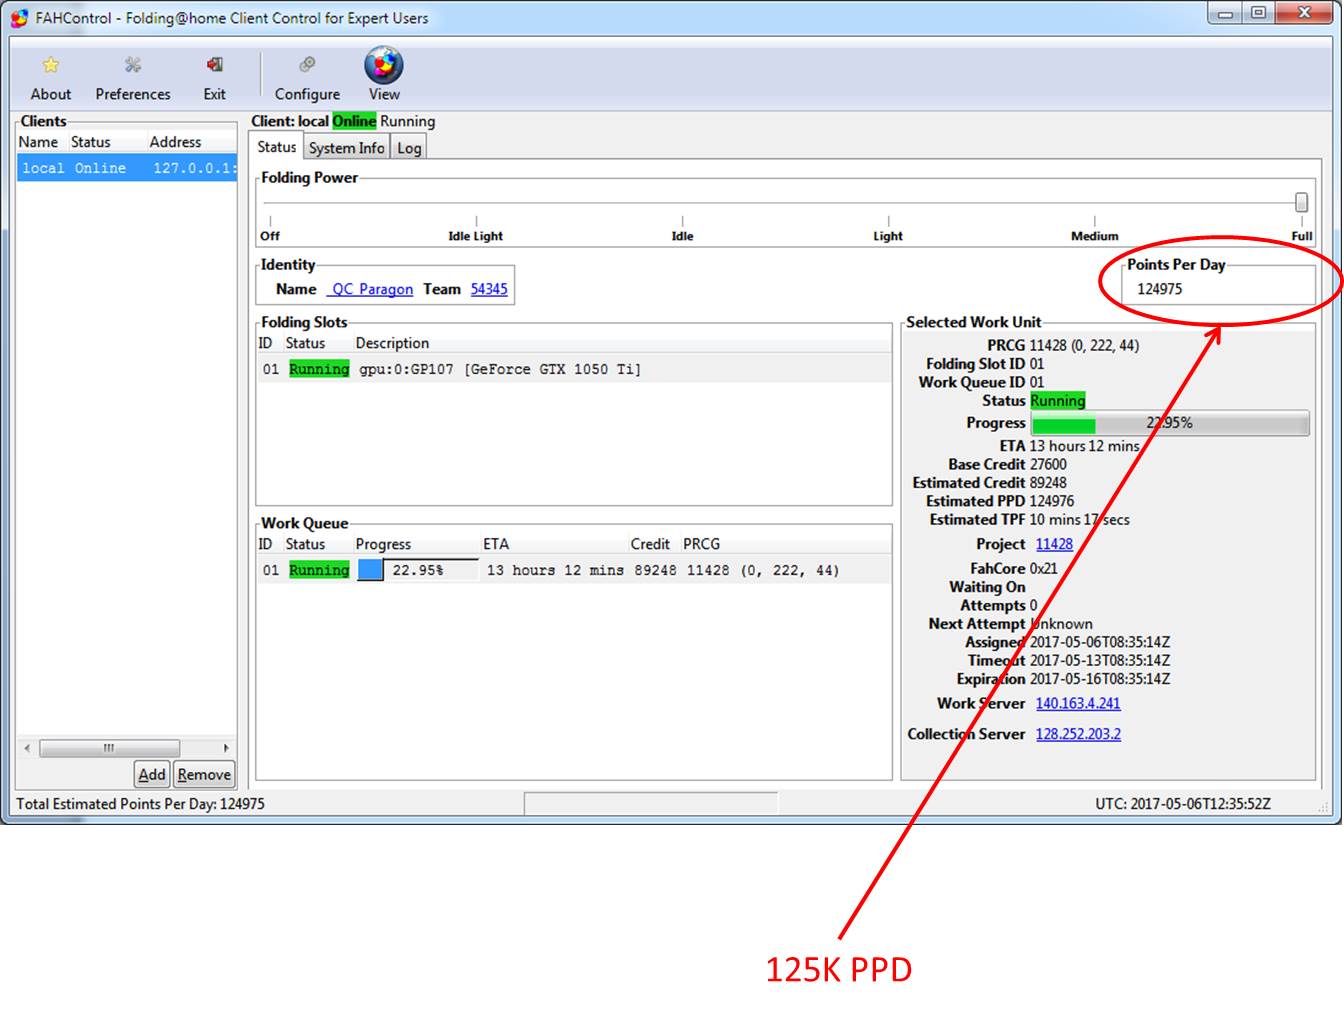
For this test I used my normal desktop computer as the benchmark machine. Testing was done using Stanford’s V7 client on Windows 10 64-bit running FAH Core 21 work units. The video driver version used was initially 388.59, and subsequently 372.90. Power consumption measurements reported in the charts were taken at the wall and are thus full system power consumption numbers.
If you’re interested in reading about the hardware configuration of my test rig, it is summarized in this post:
https://greenfoldingathome.com/2017/04/21/cpu-folding-revisited-amd-fx-8320e-8-core-cpu/
Information on my watt meter readings can be found here:
I Got a New Watt Meter!
Initial Testing and Troubleshooting
Like the GTX 1060, the 1070 uses Nvidia’s Pascal architecture, which is very efficient and has a reputation for solid compute performance. The 1070 has 50% more CUDA cores than the 1060, and with Folding@Home’s exponential points system (the quick return bonus gives you more points for doing work quickly), we should see roughly double the PPD of the 1060, which does 300 – 350 thousand PPD depending on the work unit. Based on various people’s experiences, and especially this forum post, I was expecting the 1070 to produce somewhere in the range of 600-700K PPD.
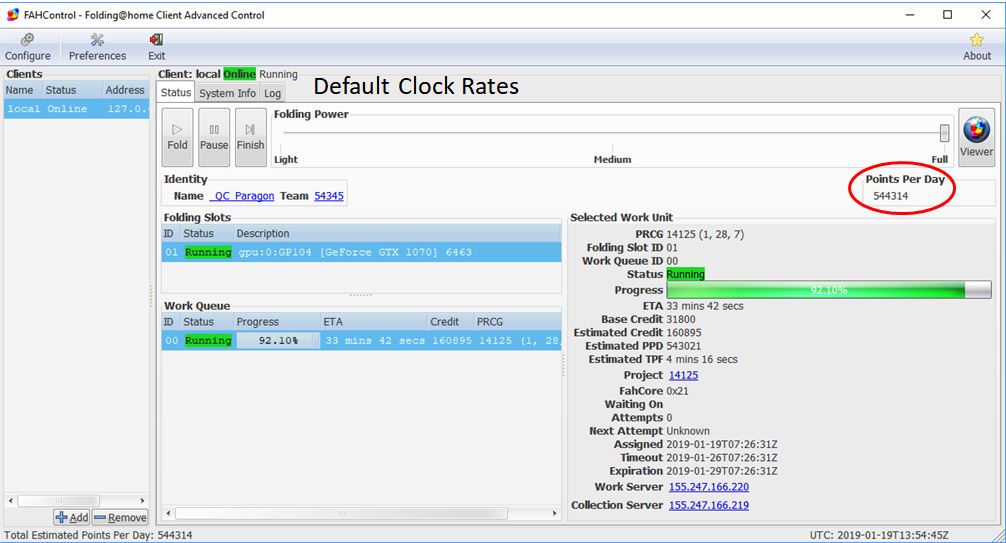
That wasn’t what happened. The card wasn’t exactly slow, but initial testing showed an estimated 450 to 550K PPD, as reported by the client. I ran it for a few days, since PPD can vary a good deal depending on the work unit, but the result was unfortunately the same. 550K PPD was about as much as my card would do.
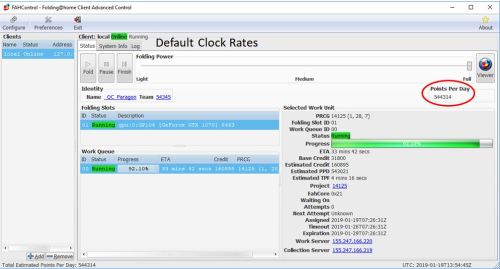
Initial GTX 1070 Results – 544K PPD
At first I thought it might be due to the card running hot. Unlike my test of a brand new 1060, I obtained my 1070 used off of eBay for a great price of $200 dollars + shipping. It was a little dusty, so I blew it all out and fired up MSI Afterburner to check out the temps. Unfortunately, the fans on the card weren’t even breaking a sweat, and it was nice and cool. Points didn’t increase.
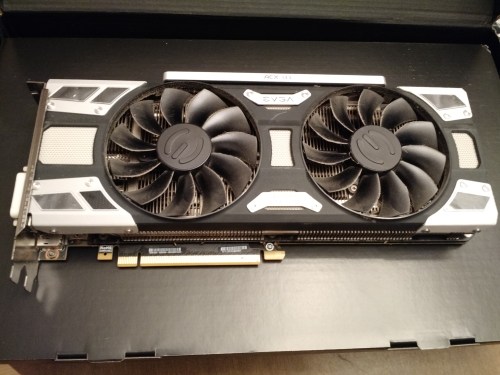
My Used EVGA GTX 1070 ACX 3.0 – eBay Price: $200
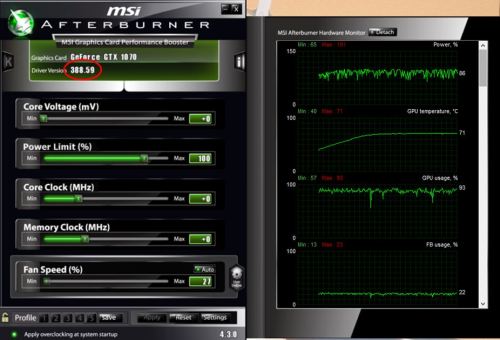
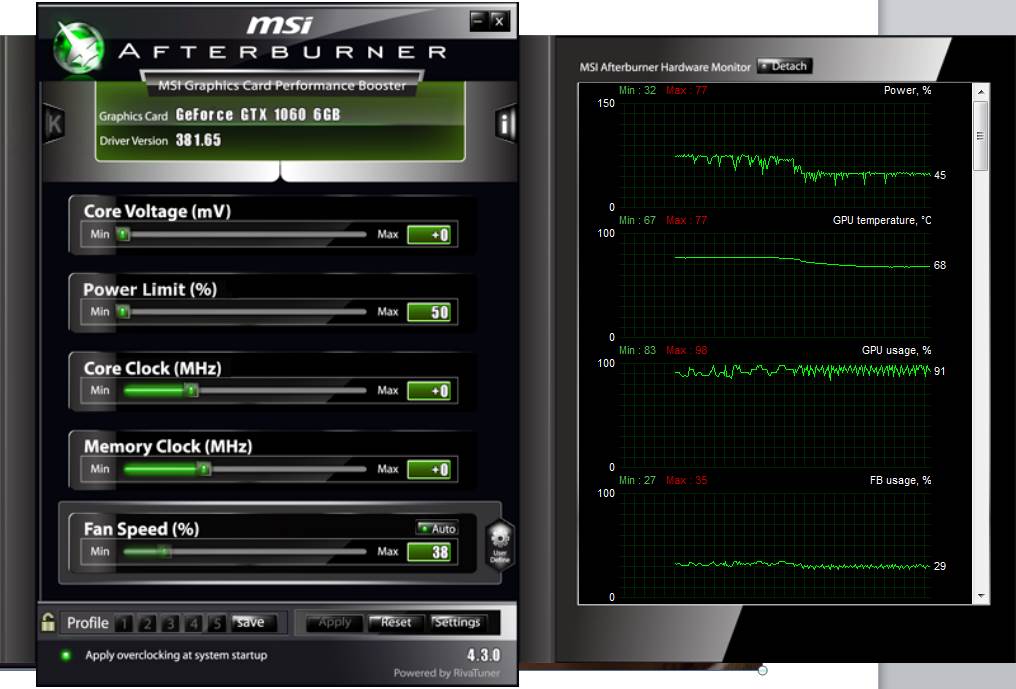
MSI Afterburner Report: NVidia GTX 1070, Stock Clocks, Driver 388.59
After doing some more digging, I ran across a few threads online that indicated the 1070 (along with a few other GTX models) don’t always boost up to their maximum clock rates for compute loads. Opening up a video, or Folding@home’s protein viewer, can sometimes force the card to clock up. I tried this and didn’t have any luck. My card was running at the stock clocks, and in fact the memory even appeared to be running 200 Megahertz below the 4000 Mhz reference clock rate. This suggested the card was in a low-power mode.
Thankfully, Nvidia’s System Management Interface tool can be used to see what is going on. This tool, which in Windows 10 lives in C:\Program Files\Nvidia Corporation, can be accessed by the command line. I followed the tutorial here to learn a few things about what my 1070 was doing. Although that write-up is geared at people mining for cryptocurrency, the steps are still releveant.
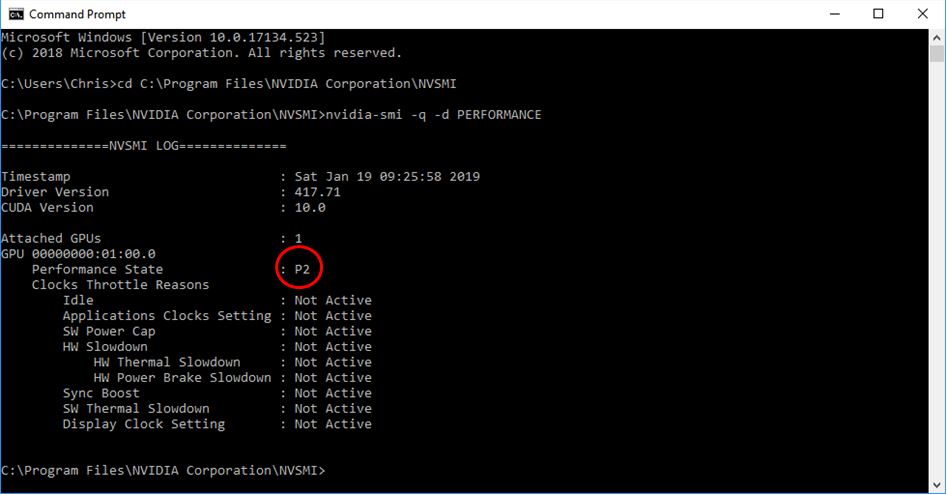
As can be seen here, my card was in the “P2” state, which is not the high-performance “P0” state. This is why the card wasn’t boosting, and why the memory clock seems diminished.
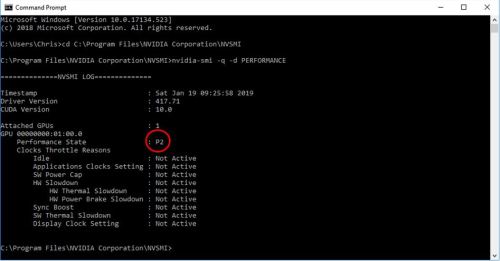
Nvidia 1070 Performance State
Another feature of the Nvidia System Management Interface is the ability to get the power consumption at the card. This is measured by the driver, using the card’s hardware, and is the total instantaneous power the card is consuming (PCI slot power + supplemental power connections). As you can see, in the P2 state, the card is very rarely nearing the 150 watt TDP.
Now, this doesn’t necessarily mean the card would get closer to 150 watts in the P0 state. F@H does not utilize every portion of the graphics card, and it is expected that the power consumption would not be right at the limit. Still, these numbers seemed a bit low to me.
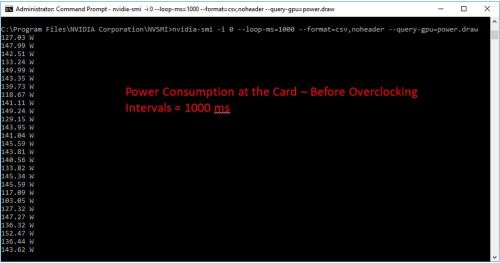
1070 card-level power consumption (before tuning)
Overclocking Manually to Approximate P0 State
Unlike what was suggested in that crypto mining article, I wasn’t able to use the NVSMI tool to force a P0 state. For some reason, my NVSMI tool wouldn’t show me the available clock rate settings for my 1070. However, manual overclocking with a program such as MSI Afterburner is really easy. By maxing out the power limit and setting the core clock to a higher value, I can basically make the card run at its boost frequency, or higher.
First, I set the power limit to the maximum allowed (112%). Don’t worry, this won’t hurt anything. It is limited in the driver to not cause any damage. Basically, this will allow the card to sip a bit more electricity (albeit at a reduction of efficiency). For a card that was in the P0 state (say, running a video game), this would allow higher boost clocks.
Next, I started upping the core clock in increments of 100 Mhz. I didn’t run into any stability problems, and settled in on a core clock of 2000 Mhz (factory clock is 1506 Mhz / 1683 boost). Note that that factory boost number is deceiving, since the latest drivers will crank the GPU core up past 1900 MHz if there is power and voltage headroom. From what I read, many people can run the 1070 stable at 2050 Mhz without adding voltage.
I decided not to boost the voltage, and to stay 50 Mhz below that supposedly stable number, because it’s not worth risking the stability of Folding@home. We want accurate, repeatable science! Plus, dropping work units is much worse for PPD than running slightly below a card’s maximum capability.
I experimented with clocking the memory up from 3800 MHz to 4000 MHz (note it’s double data rate so this equates to 8000 MHz as reported by some programs). This didn’t seem to affect results. F@H has historically been fairly insensitive to memory clocks, and boosting memory too much can cause slowdowns due to the error-checking routines having to work harder to ensure clean results. Basically, everyone says it’s not worth it. I ran it at 4000 MHz long enough to confirm this (a day), then throttled it back down to 3800 MHz. The benefit here will be more power available for the GPU cores, which is what really counts for folding.
Here are my final overclock numbers. The card has been running with these clocks for a week and a half non-stop, with no stability issues:
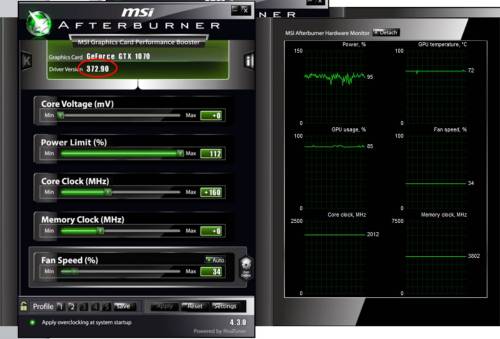
Overclocked Settings: +160 MHz Core, 112% Power Limit
Note the driver version as shown in the updated Afterburner screen shot is different…as it turns out, this can have a huge effect on F@H PPD. More on that in a moment.
Overclocking Result: An Extra 50,000 PPD
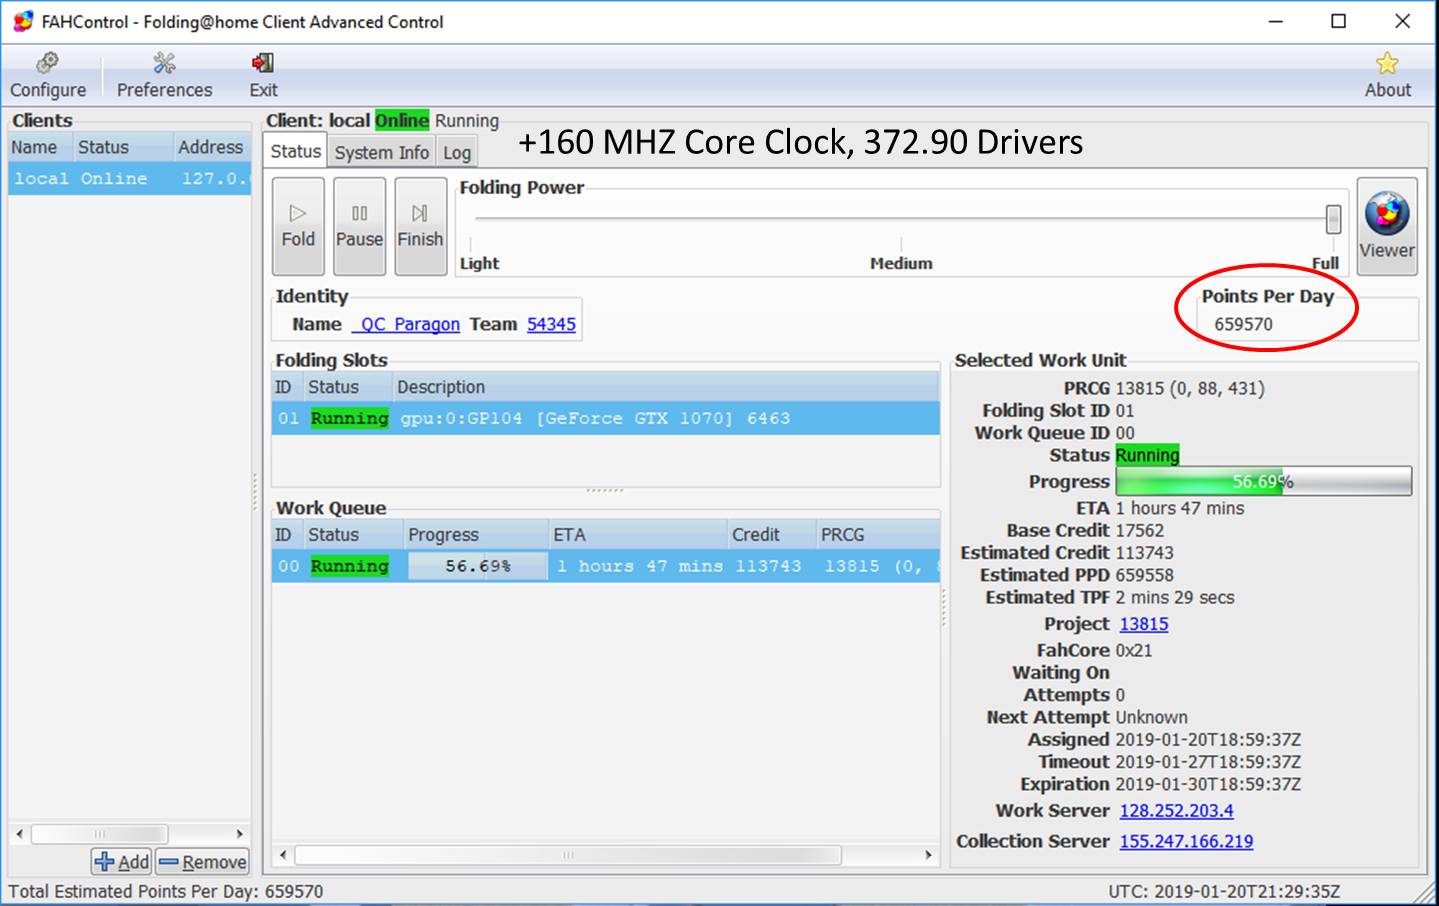
Running the core at 2012 MHz (+160 MHz boost from the P2 power state) and upping the card’s power limit by 12% made the average PPD, as observed over two days, climb from 500-550K PPD to 550K-600K PPD. So, that’s a 50,000 PPD increase for minimal effort. But, something still seemed off. At the time I was still running driver version 388.59, and one of the things I had discovered when searching around for 1070 tuning tips is that not all drivers are created equal.
Nvidia Driver 372.90: The Best Folding Driver for the GTX 1070
Nvidia has been updating drivers with more and more emphasis on gaming optimizations and less on compute. So, it makes sense that older drivers might actually offer better compute performance. There are many threads in the Folding@Home Hardware Forum discussing this, and one driver version that keeps being mentioned is 372.90. It’s a bit tricky to keep it installed on Windows 10, since Windows is always trying to push a newer version, but for my 24/7 folding rig, I installed it and simply never rebooted it in order to get a week’s worth of data.
This driver change alone seemed to also offer a 50,000 point boost. After running various core 21 work units, the GTX 1070’s PPD has stayed between 630,000 and 660,000. This is normal variation between work units, and I feel confident reporting a final PPD of 640K. As I write this, the client is estimating 660K PPD.
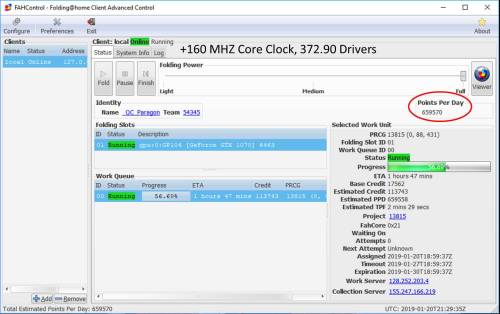
Nvidia GTX 1070: 660K PPD on Project 13815 (Core 21)
This is an excellent result. It’s twice the PPD of the GTX 1060, although eking out that last 100K PPD took a manual overclock plus a driver “update” to an older version.
Now, for the fun part. Efficiency! This 1070 is rated at 150 watts, which is only 30 watts more than the 1060. So we are supposedly doing 100% more science for Stanford University, and for a meager 25% increase in power consumption. Time to bust out the watt meter and find out!
Power Consumption at the Wall
Using my P3 Kill-A-Watt Power Meter, I measured the total system power consumption. This is the same way I measure all of my graphics cards (as opposed to estimating the card’s power by the TDP or using the video card driver to spit out instantaneous card power). The reason is that I like to have a full-system view, factoring in the power usage of my CPU, main board, and RAM, all essential components to keep the card happy.
While folding with the GTX 1070, my system’s total power draw varied between 225 and 230 watts. I’m going to go with 227 watts as the average power number.
Efficiency
Computing computational efficiency as Points Per Day (PPD) / Power (Watts) gives:
640,000 PPD / 227 Watts = 2820 PPD/Watt.
Conclusion
The Nvidia GTX 1070 is a very efficient card for running Stanford’s Folding@Home Distributed Computing Project. The trend established in my previous articles seems to be continuing, namely that the more expensive high-end video cards are more efficient, despite their higher power draw. In this case of the 1070, some manual overclocking was needed to unlock the full PPD potential. As proven by many others, the default drivers weren’t very good, but the 372.90 drivers really opened it up.
Base PPD: 550,000
Tuned PPD (drivers + overclock) = 640,000
PPD/Watt(@wall) = 2820
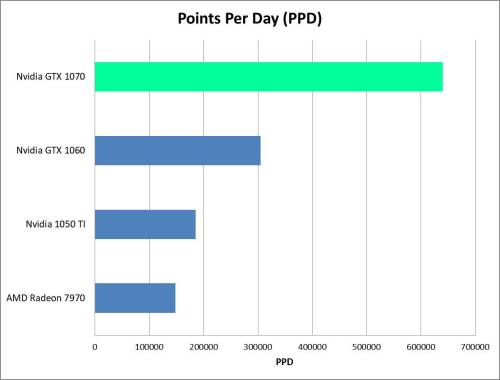
Nvidia GTX 1070 Performance Comparison
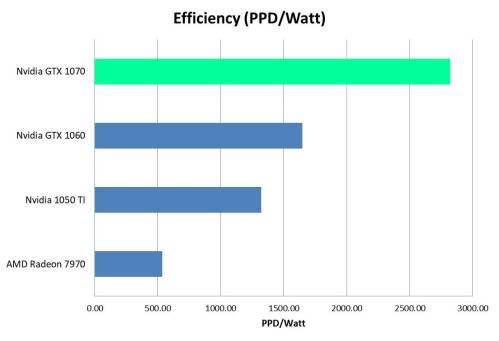
Nvidia 1070 Efficiency Comparison
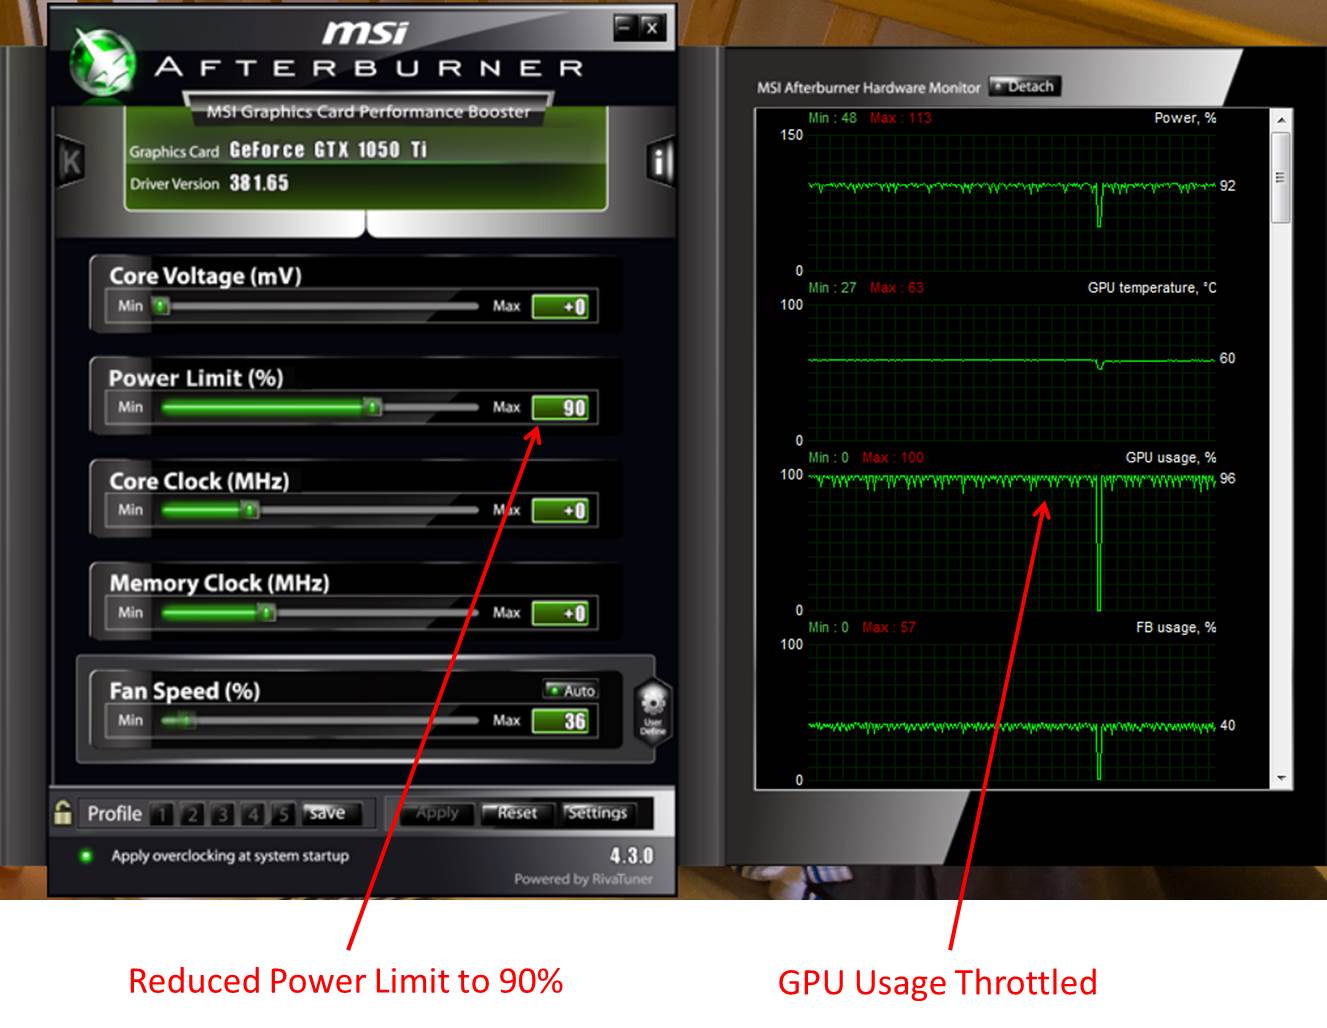
As a final note, this post focused more on PPD than efficiency, since for much of the testing my watt meter was not installed (my kids keep playing with it). At some point in the future, I’ll do an article where I tune one of these cards to find the best efficiency point. This will likely be at a lower power limit than 100%, with perhaps a slight reduction in clock rate.