This is part four of my Folding@Home review for AMD’s top-tier desktop processor, the Ryzen 9 3950x 16-core CPU. Up until recently, this was AMD’s absolute beast-mode gaming and content creation desktop processor. If you happen to have one, or are looking for a good CPU to fight COVID and Cancer with, you’ve come to the right place.
Folding@Home is a distributed computing project where users can donate computational runtime on their home computers to fight diseases like Cancer, Alzheimer’s, Mad-Cow, and many others. For better or for worse, COVID-19 caused an explosion of F@H popularity, because the project was retooled to focus on understanding the coronavirus molecule to aid researches develop ways to fight it. This increase in users caused Folding@Home to become (once again) the most powerful supercomputer in the world. Of course this comes with a cost: namely, in the form of electricity. Most of my articles to date have focused on GPU folding. However, the point of this series of articles is to investigate how someone running CPU folding can optimize their settings to do the most work for the least amount of power, thus reducing their power bill and reducing the environmental impact of all this computing.
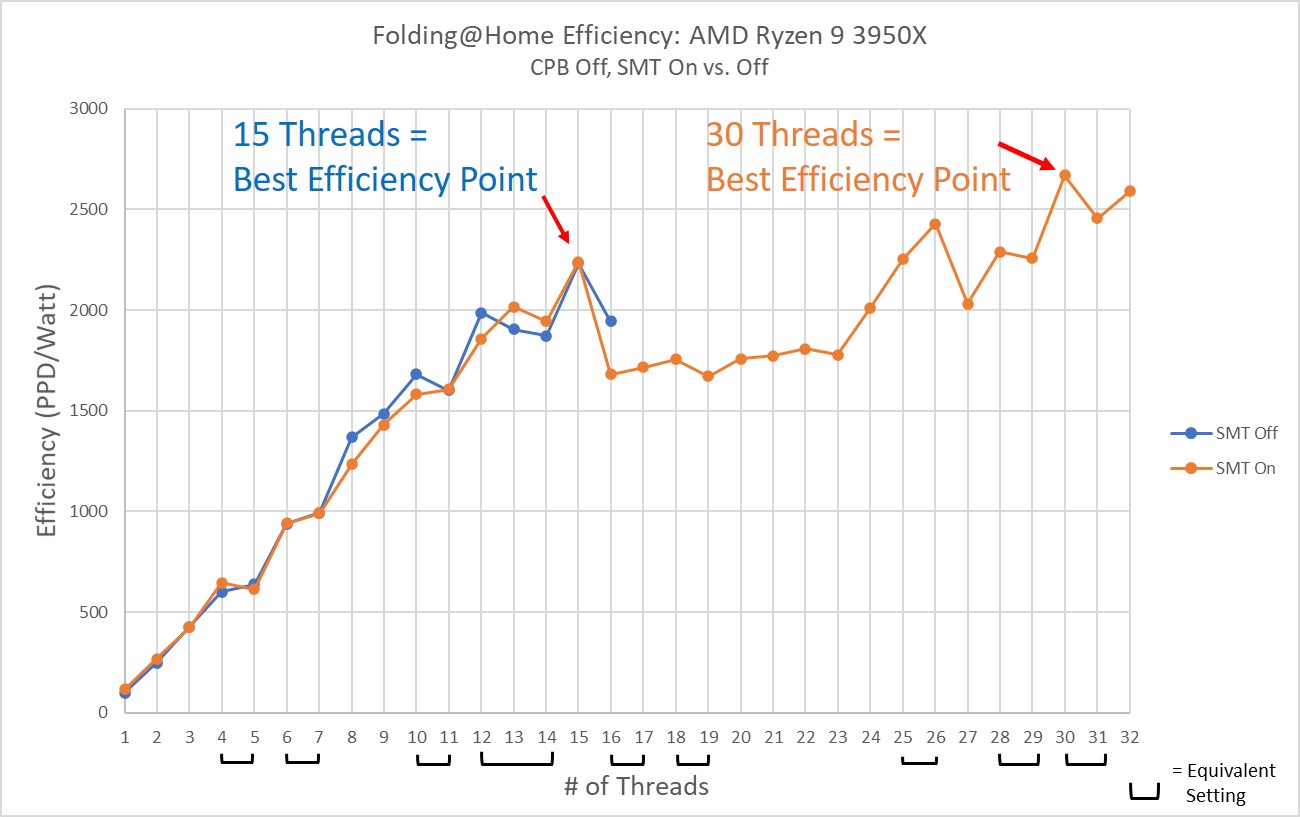
In the last part of this review, I investigated the differences seen between running Folding@Home with SMT (also known as Hyperthreading) on and off. The conclusion from that review was that performance does scale with virtual cores, and that the best science-fighting and energy efficiency is seen with 30 or 32 threads enabled on the CPU folding slot.
The previous testing was all performed with Core Performance Boost off. CPB is the AMD equivalent of Intel’s Turbo Boost, which is basically automatic, dynamic overclocking of the processor (both CPU frequency and voltage) based on the load on the chip. Keeping CPB turned off in previous testing resulted in all tests being run with the CPU frequency at the base 3.5 GHz.
In this final article, I enabled CPB to allow the Ryzen 9 3950x to scale its frequency and voltage based on the load and the available thermal and power headroom. Note that for this test, I used the default AMD settings in the BIOS of my Asus Prime X570-P motherboard, which is to say I did not enable Precision Boost Overdrive or any other setting to increase the automatic overclocking beyond the default power and thermal limits.
Test Setup
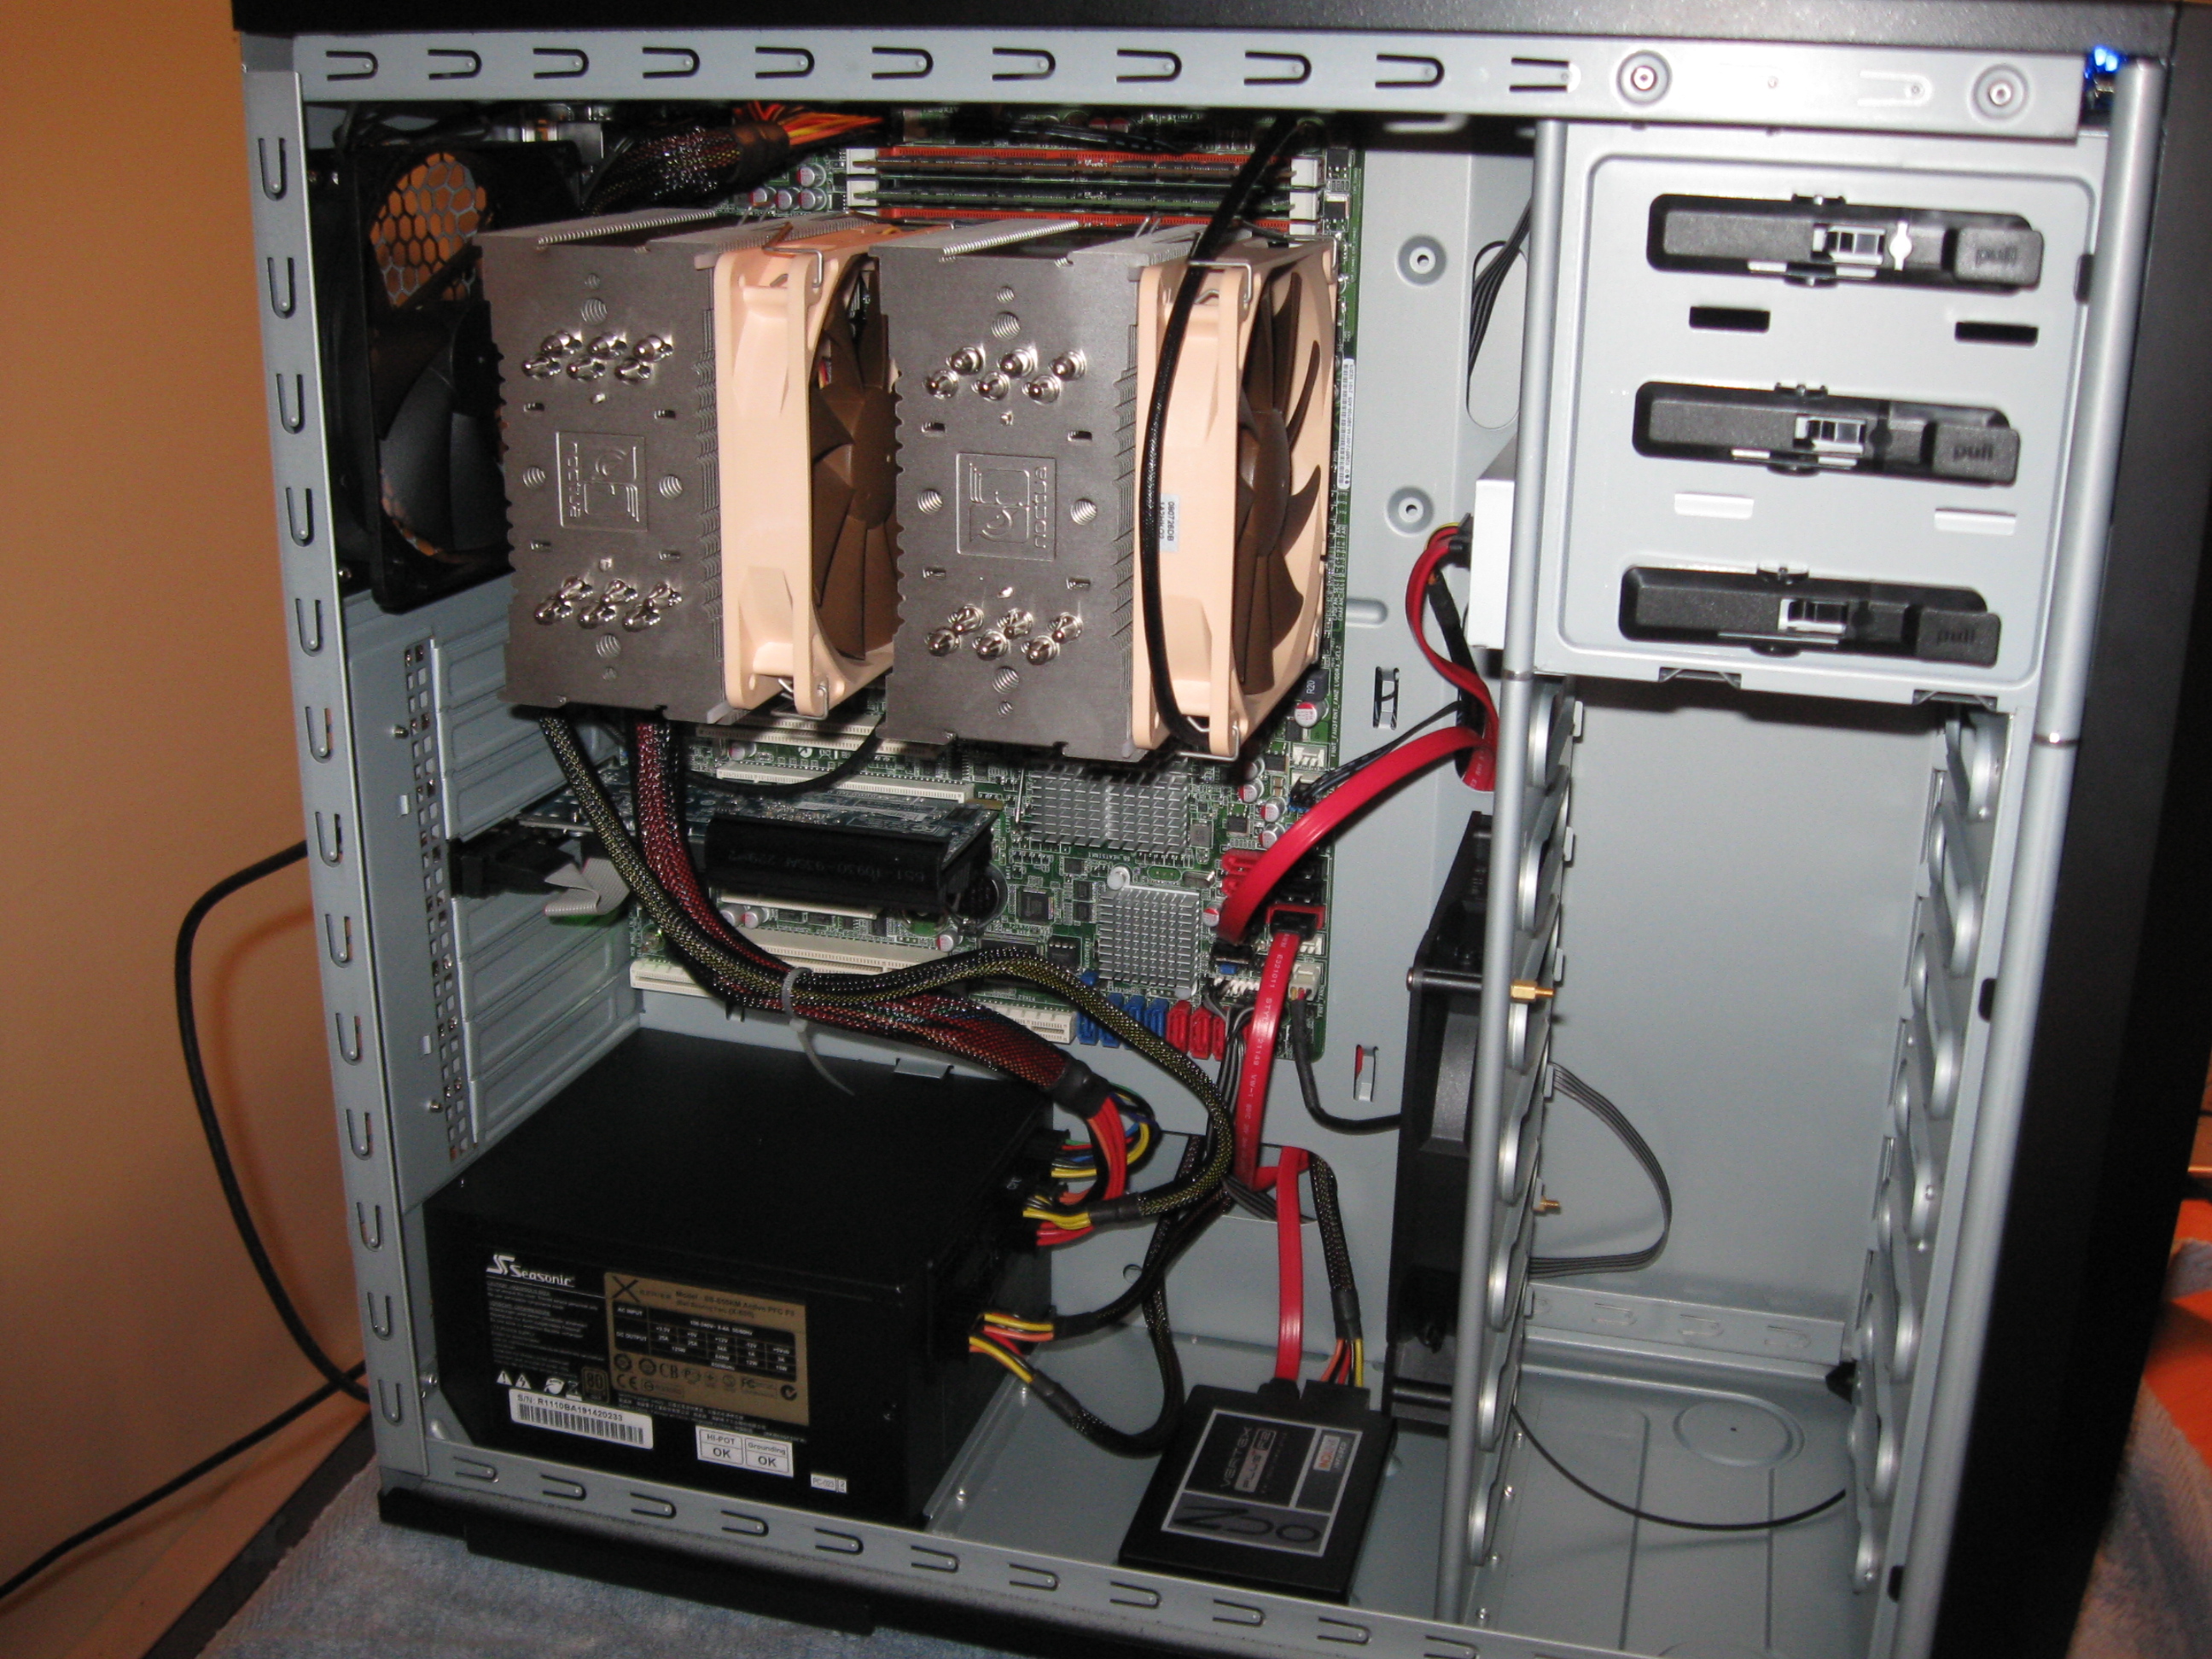
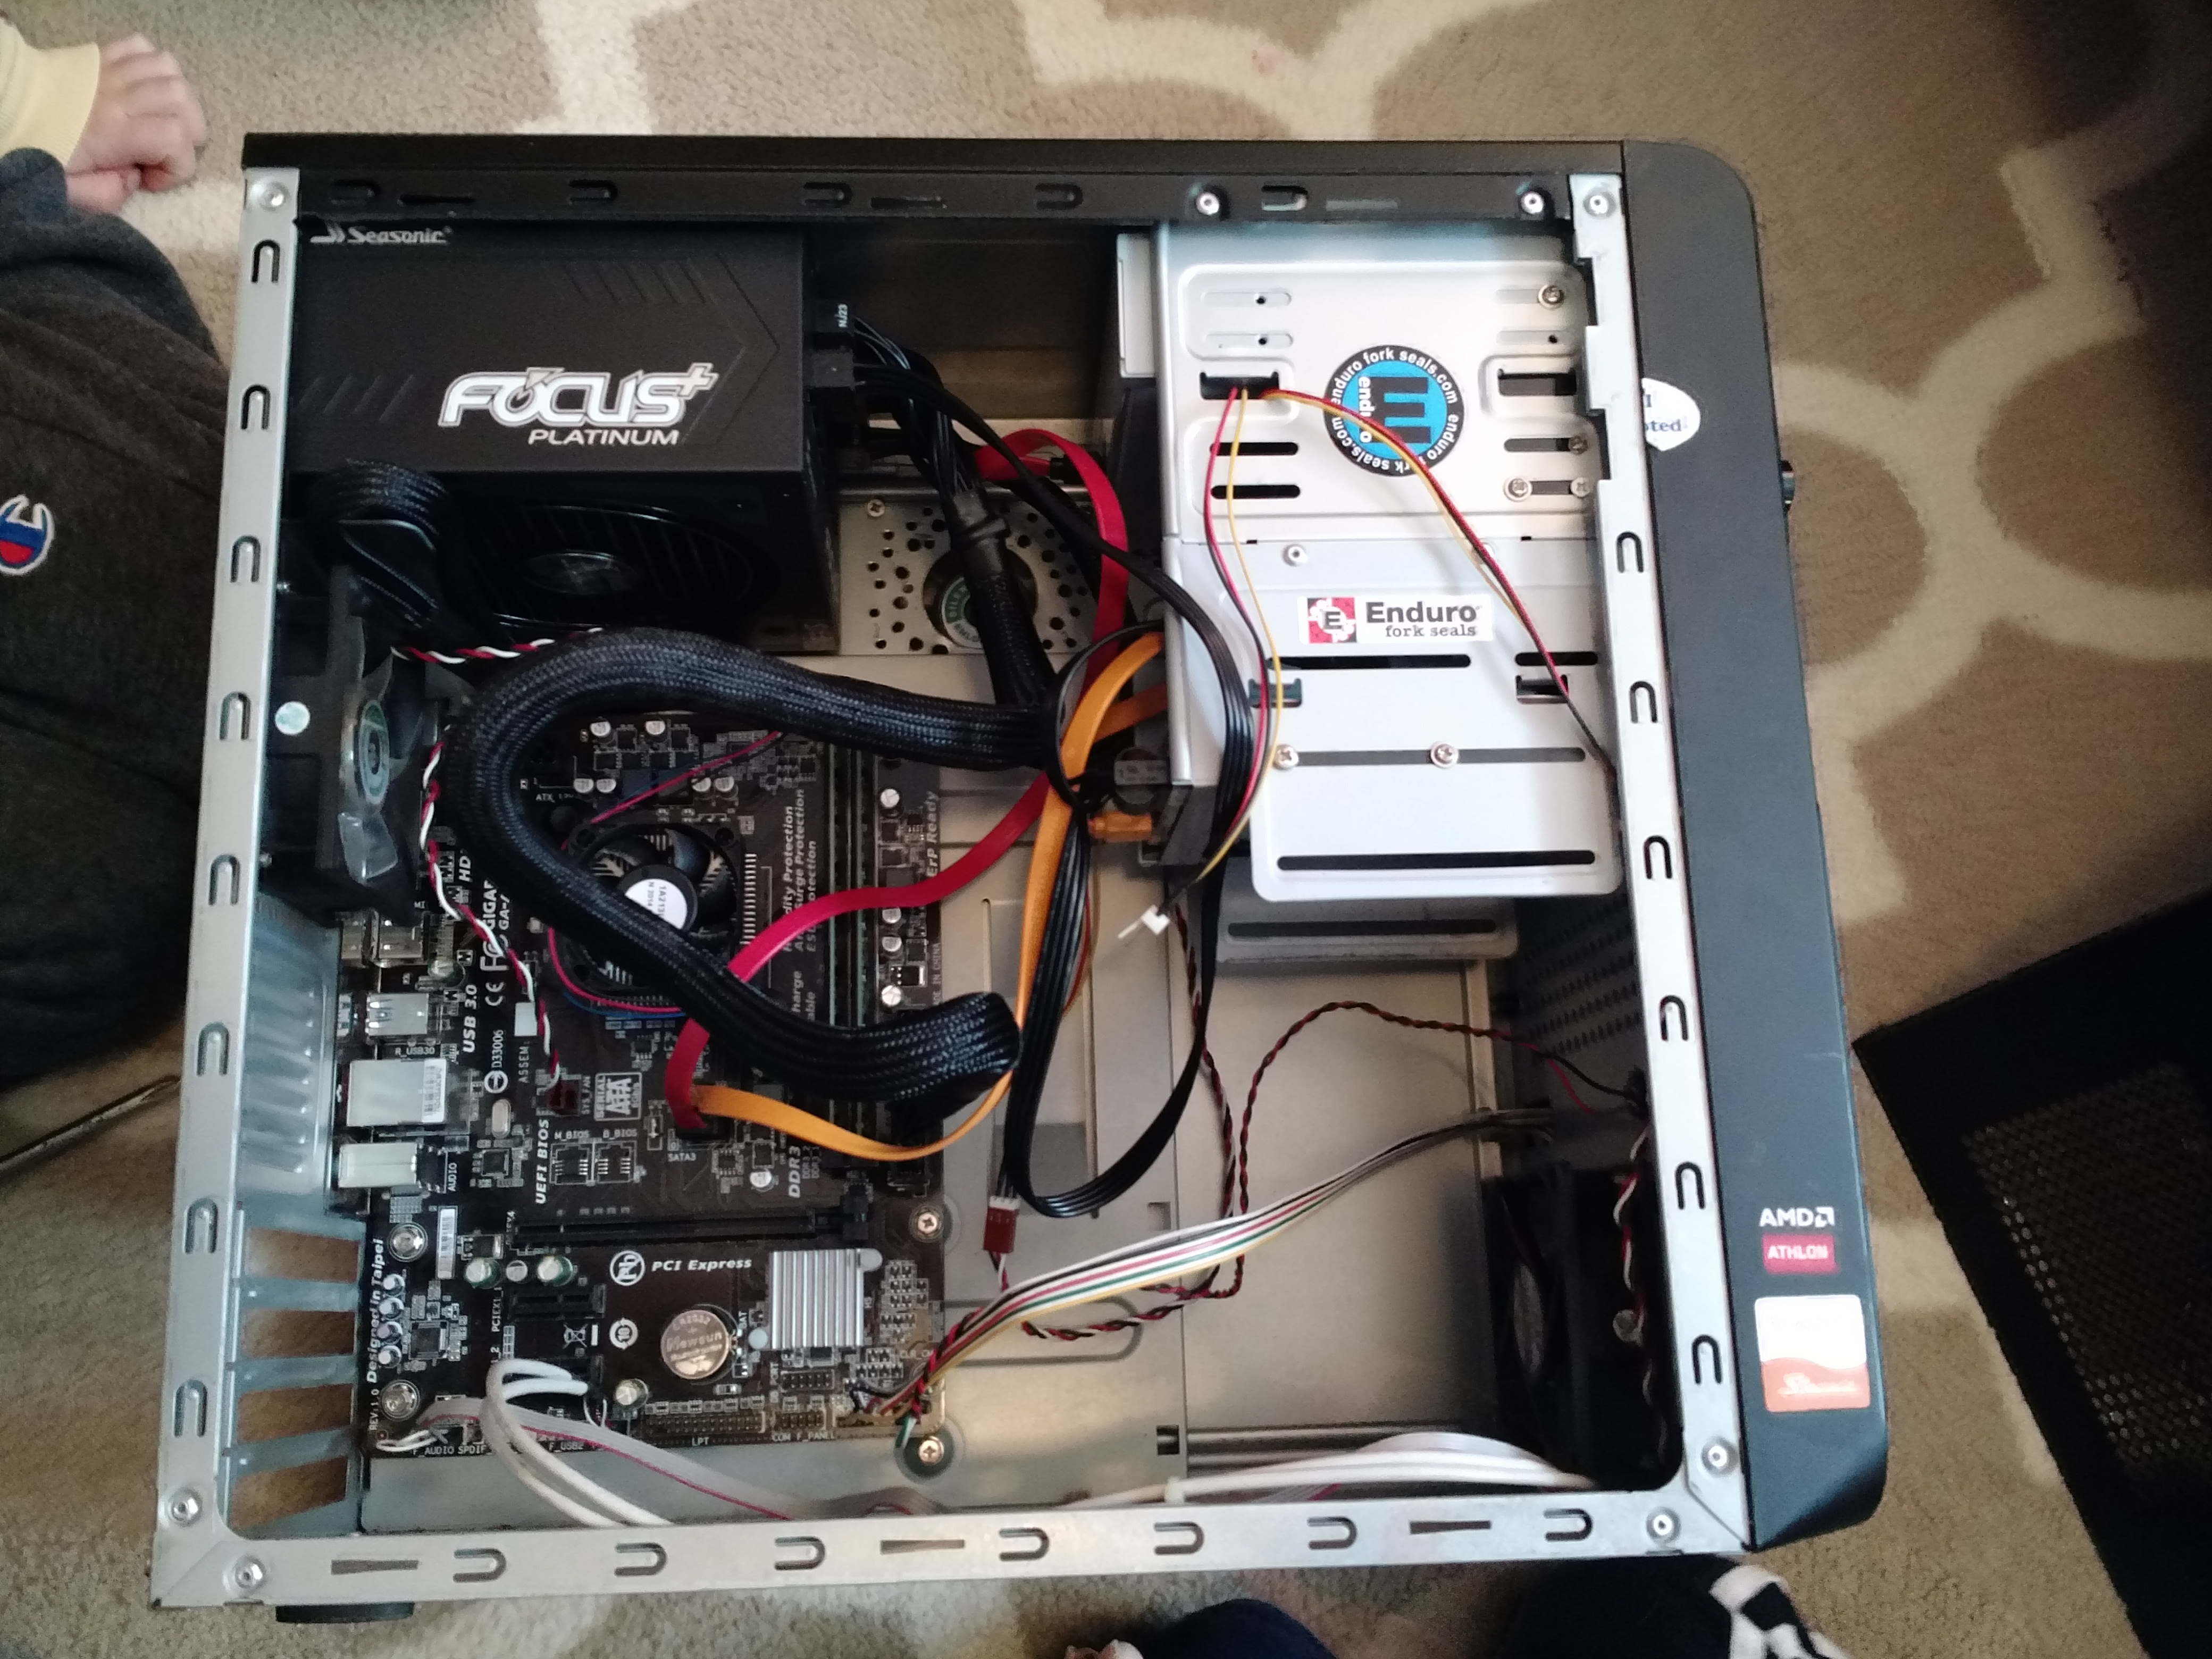
As with the other parts of this review, I used my new Folding@Home benchmark machine which was previously described in this post. The only tweaks to the computer since that post was written were the swap outs of a few 120mm fans for different models to improve cooling and noise. I also eliminated the 80 mm side intake fan, since all it did was disrupt the front-to-back airflow around the CPU and didn’t make any noticeable difference in temperatures. All of these cooling changes made less than a 2 watt difference in the machine’s idle performance (almost unmeasurable), so I’m not going to worry about correcting the comparison plots.
Because it’s been a while since I wrote about this, I figured I’d recap a few things from the previous posts. The current configuration of the machine is:
- Case: Raidmax Sagitta
- Power Supply: Seasonic Prime 750 Watt Titanium
- Intake Cooling: 2 x 120mm fan (front)
- Exhaust Cooling: 1 x 120 mm (rear) + PSU exhaust (top)
- CPU Cooler: Noctua NH-D15 SE AM4
- CPU: AMD Ryzen 9 3950x
- Motherboard: Asus Prime X570-P
- Memory: 32 GB Corsair Vengeance LPX DDR4 3600 MHz
- GPU: Zotac Nvidia GeForce 1650 installed for CPU testing
- OS Drive: Samsung 970 Evo Plus 512 GB NVME SSD
- Storage Drive #1: Samsung 860 EVO 2TB SSD
- Storage Drive #2: Western Digital Blue 128 GB NVME SSD
- Optical Drive: Samsung SH-B123L Blu-Ray Drive
- Operating System: Windows 10 Home
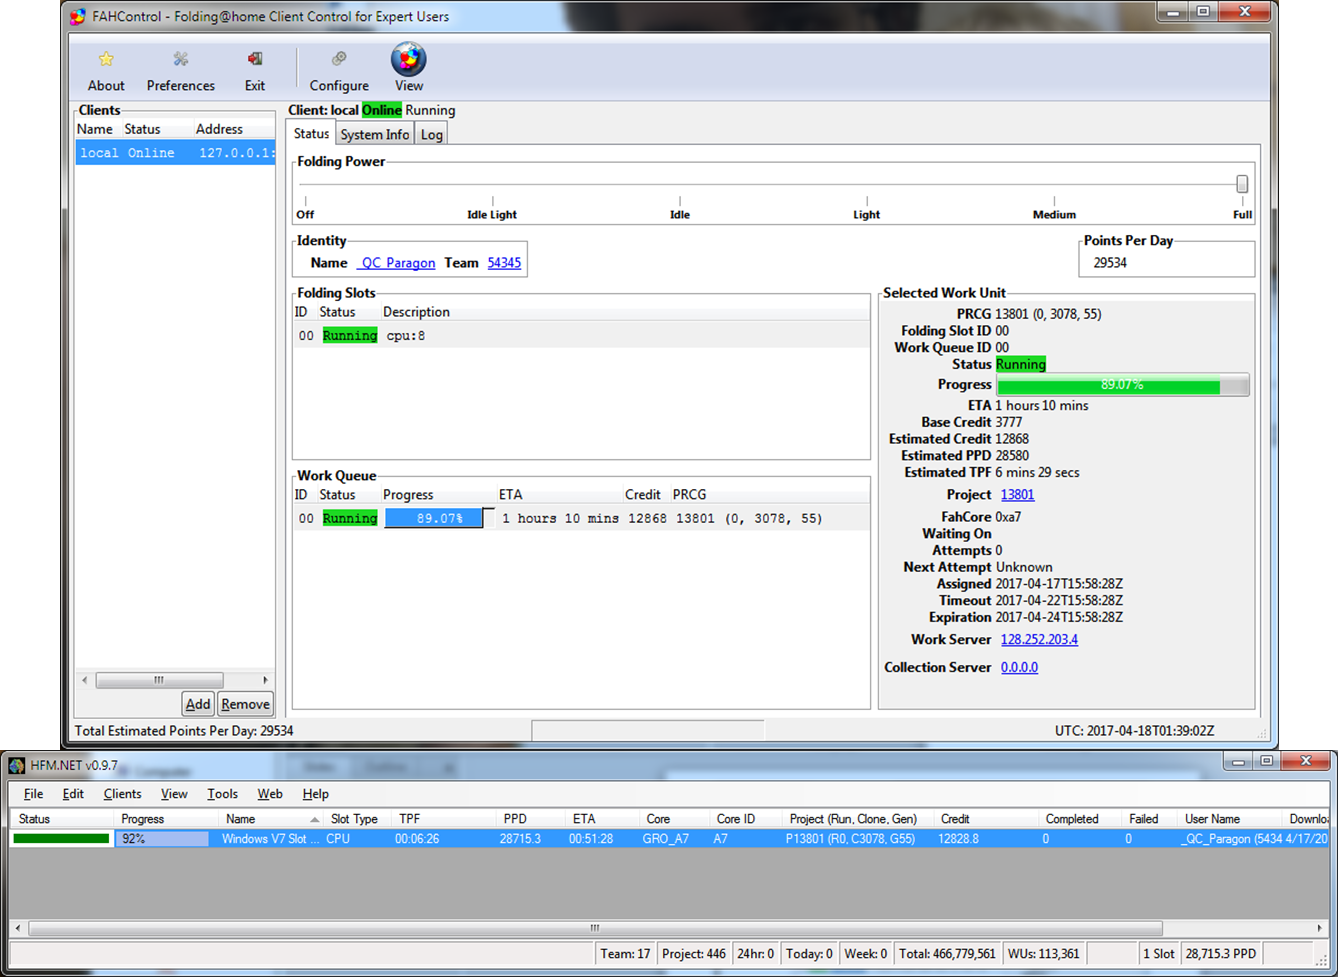
The Folding@Home software client used was version 7.6.13.
Test Methodology
The point of this testing is to identify the best settings for performance and energy efficiency when running Folding@Home on the Ryzen 3950x 16-core processor. To do this, I set the # of threads to a specific value between 1 and 32 and ran five work units. For each work unit, I recorded the instantaneous points per day (PPD) as reported in the client, as well as power consumption of the machine as reported on my P3 Kill A Watt meter. I repeated this 32 times, for a total of 160 tests. By running 5 tests at each nCPU setting, some of the work unit variability can be averaged out.

Folding@Home Performance: Ryzen 9 3950X
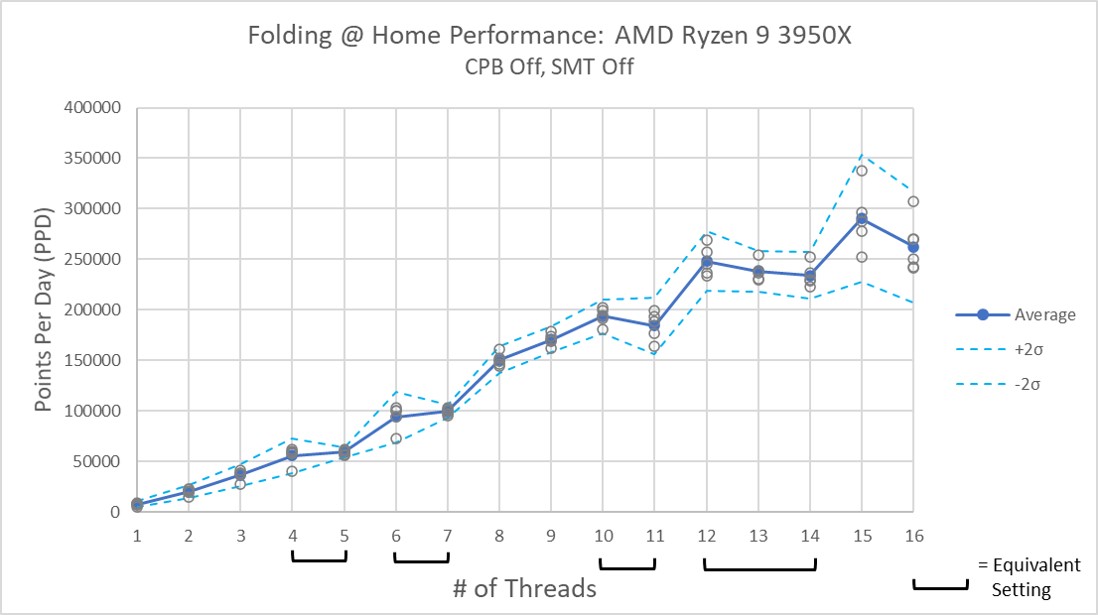
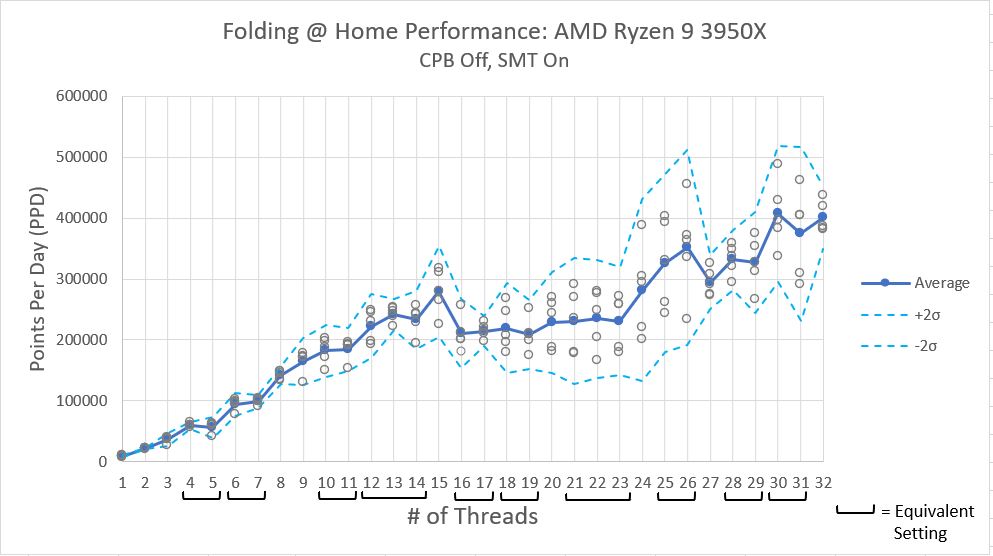
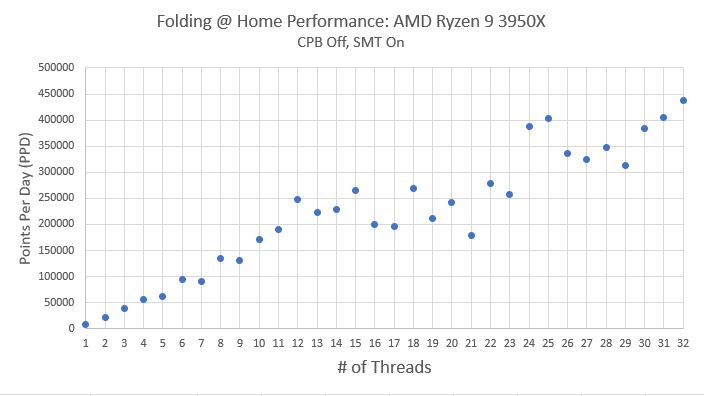
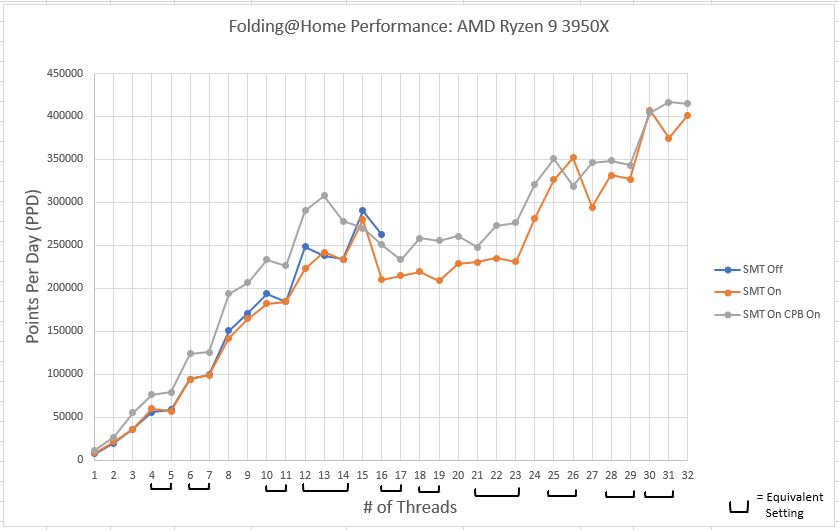
Folding@Home performance is measured in Points Per Day (PPD). This is the numbe that most people running the project are most interested in, as generating lots of PPD means your machine is doing a lot of good science to aid the researchers in their fight against diseases. The following plot shows the trend of Points Per Day vs. # of CPU threads engaged. The average work unit variation came out to being around 12%…this results in a pretty significant spread in performance between different work units at higher thread counts. As in the previous testing, I plotted a pair of boundary lines to capture the 95% confidence interval, meaning that assuming a Gaussian distribution of data points, 95% of the work units will perform between in this boundary region.

As can be seen in the above plot, in general, the Folding@Home client’s Points Per Day production increases with increasing core count. As with the previous results, the initial performance improvement is fairly linear, but once the physical number of CPU cores is exceeded (16 in this case), the performance improvement drops off, only ramping up again when the core settings get into the mid 20’s. This is really strange behavior. I suspect it has something to do with how Windows 10 schedules logical process threads onto physical CPU cores, but more investigation is needed.
One thing that is different abut this test is that the Folding@Home consortium started releasing new work units based on the A8 core. These work units support the AVX2_256 instruction set, which allows some mathematical operations to be performed more efficiently on processors that support AVX2 (specifically, an add operation and a multiply operation can be performed at the same time). As you can see, the Core A8 work units, denoted by purple dots, fall far above the average performance and the 95% confidence interval lines. Although it is awesome that the Folding@Home developers are constantly improving the software to take advantages of improved hardware and computer programming, this influx of fancy work units really slowed my testing down! There were entire days when all I would get were core A8 units, when I really need core A7 units to compare to my previous testing. Sigh…such is the price of progress. Anyway, these work units were excluded from the 5-work unit averages composing each data point, since I want to be able to compare the average performance line to previous testing, which did not include these new work units.
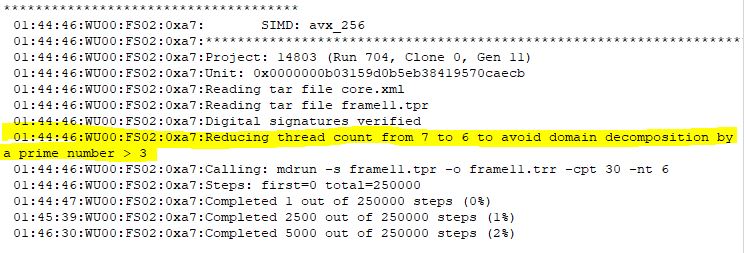
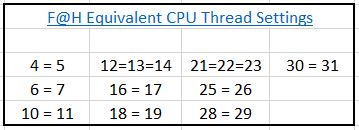
As noted in my previous posts, some settings of the # of CPU threads result in the client defaulting to a lower thread count to prevent numerical problems that can arise for certain mathematical operations. For reference, the equivalent thread settings are shown in the table below:
Equivalent Thread Settings:
Folding@Home Power Consumption
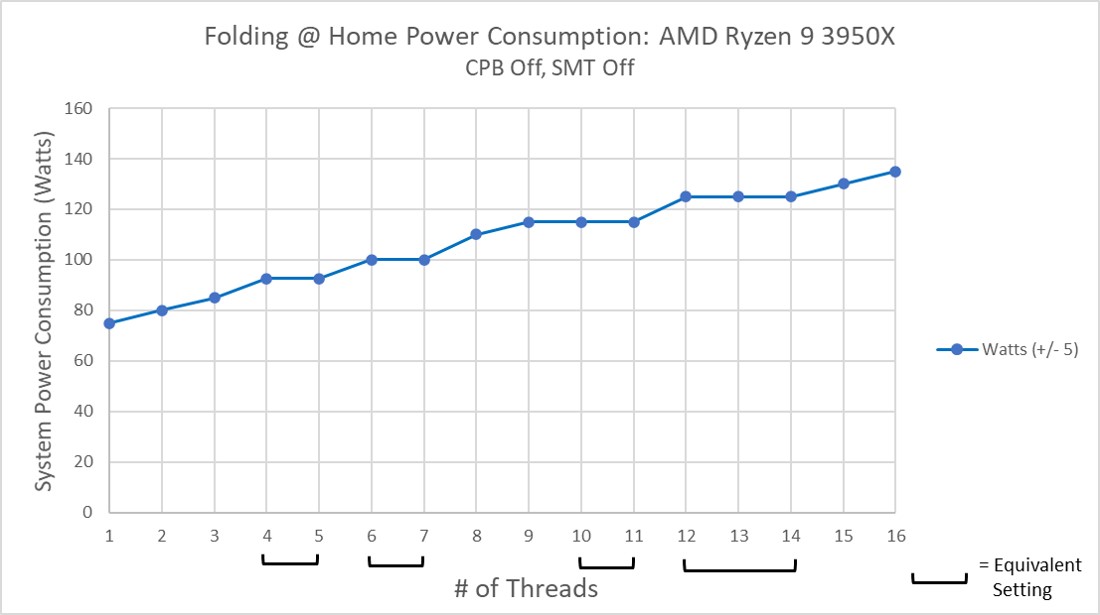
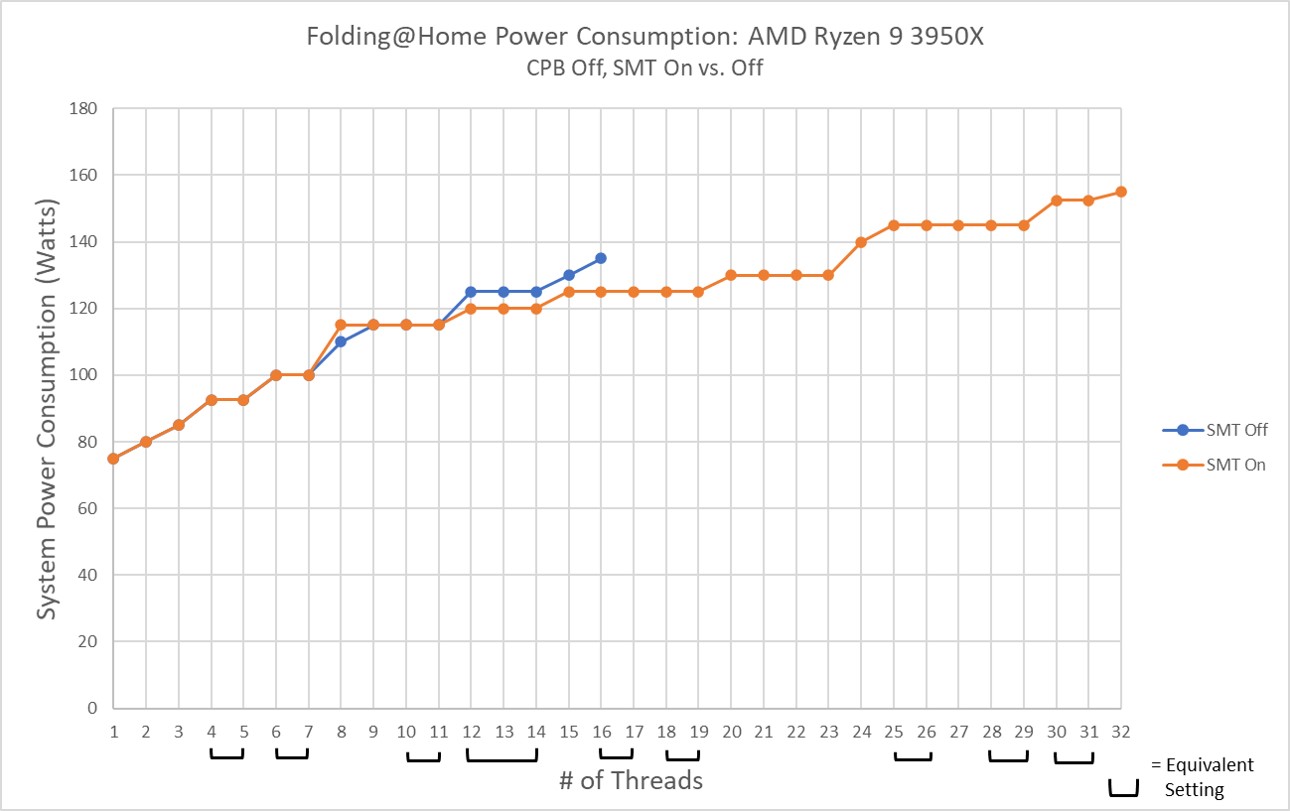
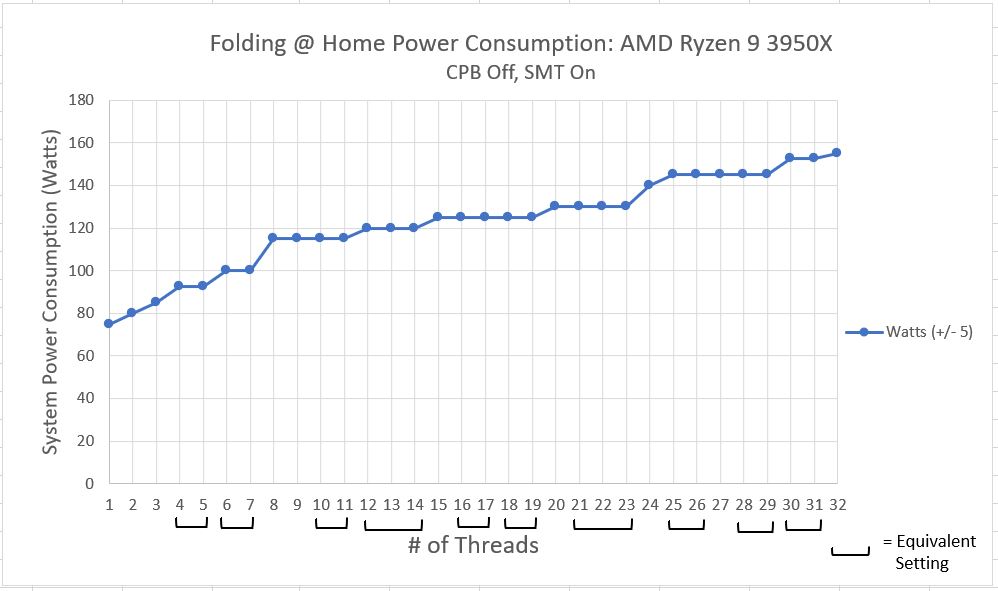
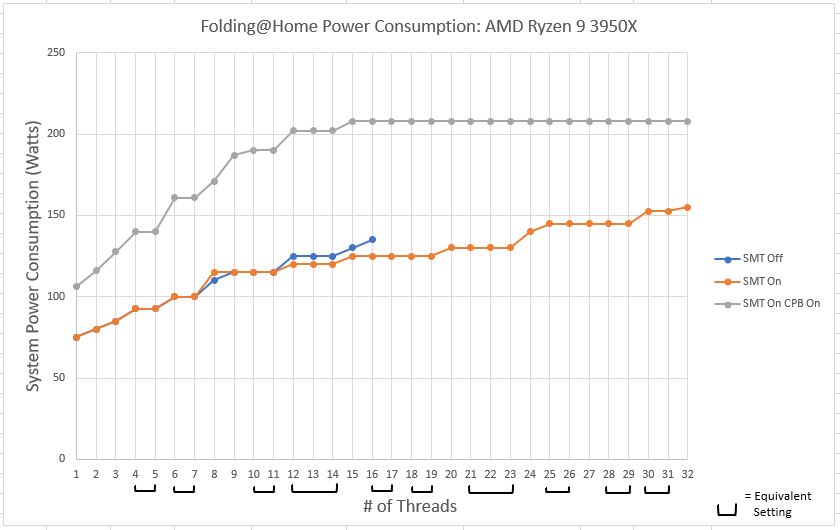
Here is a much simpler plot. This is simply the power consumption as reported by my P3 Kill A Watt meter at the wall. This is total system power consumption. As expected, it increases with increasing core count. Since the instantaneous power the computer is using wobbles around a bit as the machine is working, I consider this to be an “eyeball averaged” plot, with an accuracy of about 5 watts.

As can be seen in the above plot, something interesting starts happening at higher thread counts: namely, the power consumption plateaus. This wasn’t seen in previous testing with Core Performance Boost set to off. Essentially, with CPB on, the machine is auto-overclocking itself within the factory defined thermal and power consumption limits. Eventually, with enough cores being engaged, a limit is reached.
Investigating what is happening with AMD’s Ryzen Master software is pretty enlightening. For example, consider the following three screen shots, taken during testing with 2, 6, and 16 threads engaged:
2 Thread Solve:

6 Thread Solve

16 Thread Solve

First off, please notice that the temperate limit (first little dial indicator) is never hit during any test condition, thanks to the crazy cooling of the Noctua NH-D15 SE. Thus, we don’t have to worry about an insufficient thermal solution marring the test results.
Next, have a look at the second and third dial indicators. For the 2-core solve, the peak CPU speed is a blistering 4277 MHz! This is a factory overclock of 22% over the Ryzen 9 3950x’s base clock of 3500 MHz. This is Core Performance Boost in action! At this setting, with only 2 CPU cores engaged, the total package power (PPT) is showing 58% use, which means that there is plenty of electrical headroom to add more CPU cores. For the 6-core solve, the peak CPU speed has come down a bit to 4210 MHz, and the PPT has risen to 79% of the rated 142 watt maximum. What’s happening is the extra CPU cores are using more power, and the CPU is throttling those cores back a bit to keep everything stable. Still, there is plenty of headroom.
That story changes when you look at the plot for the 16-thread solve. Here, the peak clock rate has decreased to 4103 MHz and the total package power has hit the limit at 142 watts (a good deal beyond the 105 watt TDP of the 3950X!). This means that the Core Performance Boost setting has pushed the clocks and voltage as high as can be allowed under the default auto-overclocking limits of CPB. This power limit on the CPU is the reason the system’s wall power consumption plateaus at 208 watts.
If you’re wondering what makes up the difference between the 208 watts reported by my watt meter and the 142 watts reported by Ryzen Master, the answer is the rest of the system besides the CPU socket. In other words, the motherboard, memory, video card, fans, hard drives, optical drive, and the power supply’s efficiency.
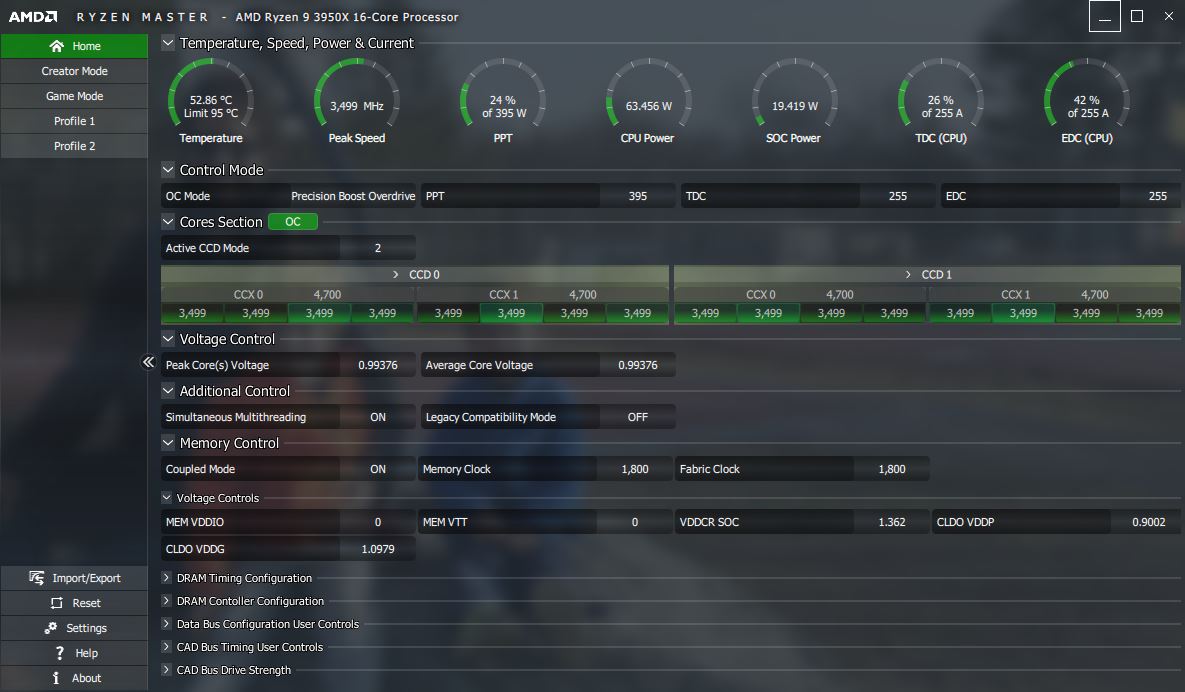
Just for fun, here is the screen shot of Ryzen Master for the full 32-core solve!

Here, we have an all-core peak frequency of 3855 MHz. Interestingly, the CPU temp and PPT have decreased slightly from the 16-core solve, even though the processor is theoretically working harder. What’s happening here is yet another limit has been reached. Look at the 6th dial indicator labeled ‘TDC’. This is a measure of the instantaneous peak current, in Amperes, being applied to the CPU. Apparently with 32 threads, this peak current limit of 95 amps is getting hit, so clock speed and voltage is reduced, resulting in a lower average socket power (PPT) than the 16-core solve.
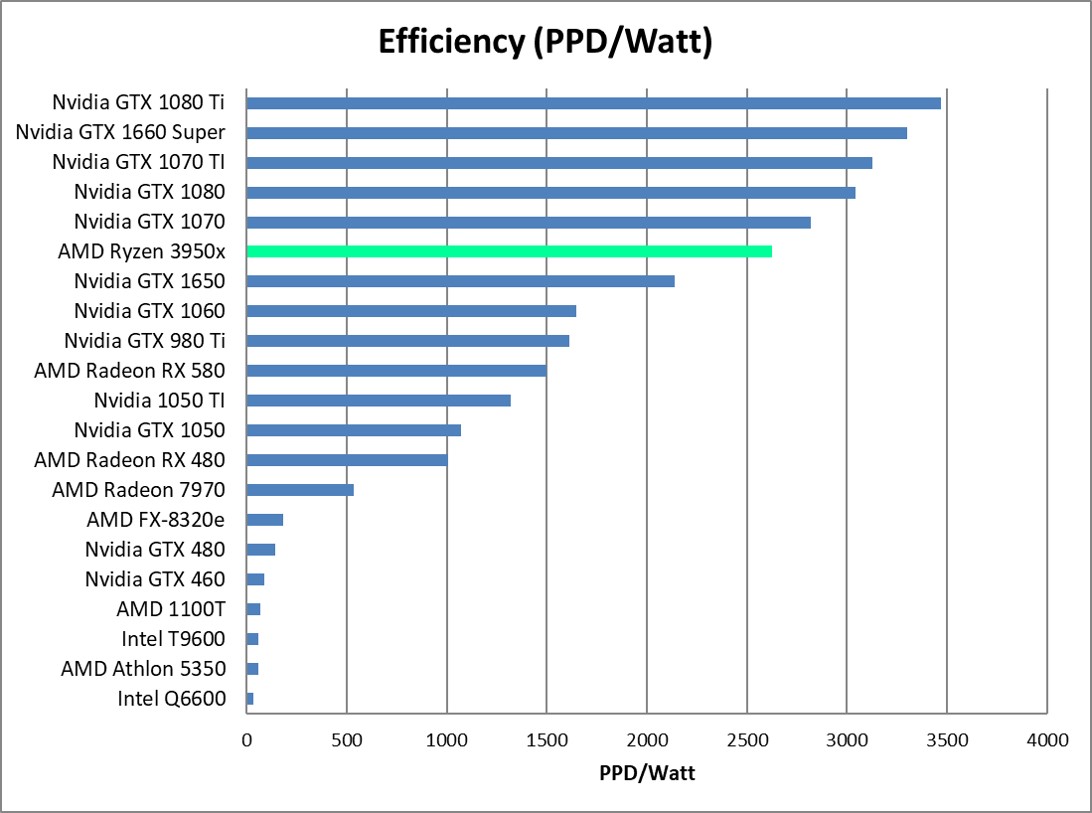
Folding@Home Efficiency
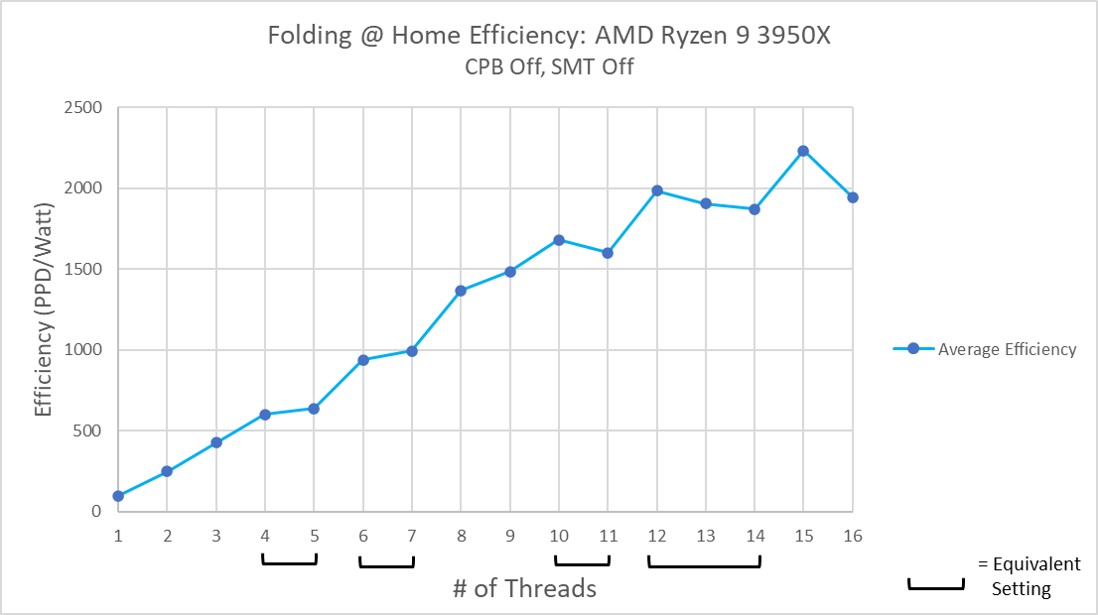
Now for my favorite plot…Efficiency! Here, I am taking the average performance in PPD (excluding the newfangled A8 work units for now) and dividing it by the system’s wall power consumption. This provides a measure of how much work per unit of power (PPD/Watt) the computer is doing.
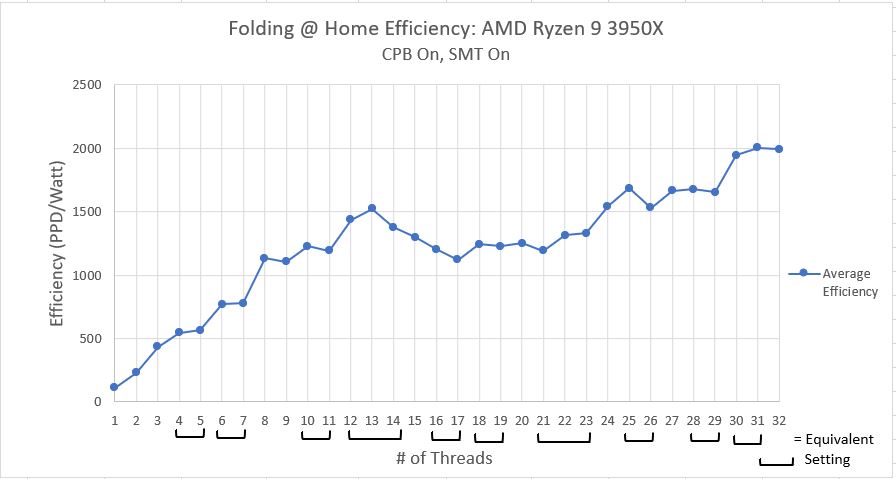
This plot looks fairly similar to the performance plot. In general, throwing more CPU threads at the problem lets the computer do more work in a unit of time. Although higher thread counts consume more power than lower thread counts, the additional power use is offset by the massive amount of extra computational work being done. In short, effiency improves as thread count improves.
There is a noticeable dent in the curve however, from 15 to 23 threads. This is this interesting region where things get weird. As I mentioned before, I think what might be happening is some oddity in how Windows 10 schedules jobs once the physical number of CPU threads has been exceeded. I’m not 100% sure, but what I think Windows is doing is potentially juggling the threads around to keep a few physical CPU cores free (basically, it’s putting two threads on one CPU core, i.e. utilizing SMT, even when it doesn’t have to, in order to keep some CPU cores available for other tasks, such as using Windows). It isn’t until we get over 24 threads that Windows decides we are serious about running all these jobs, and reluctantly schedules the jobs out for pure performance.
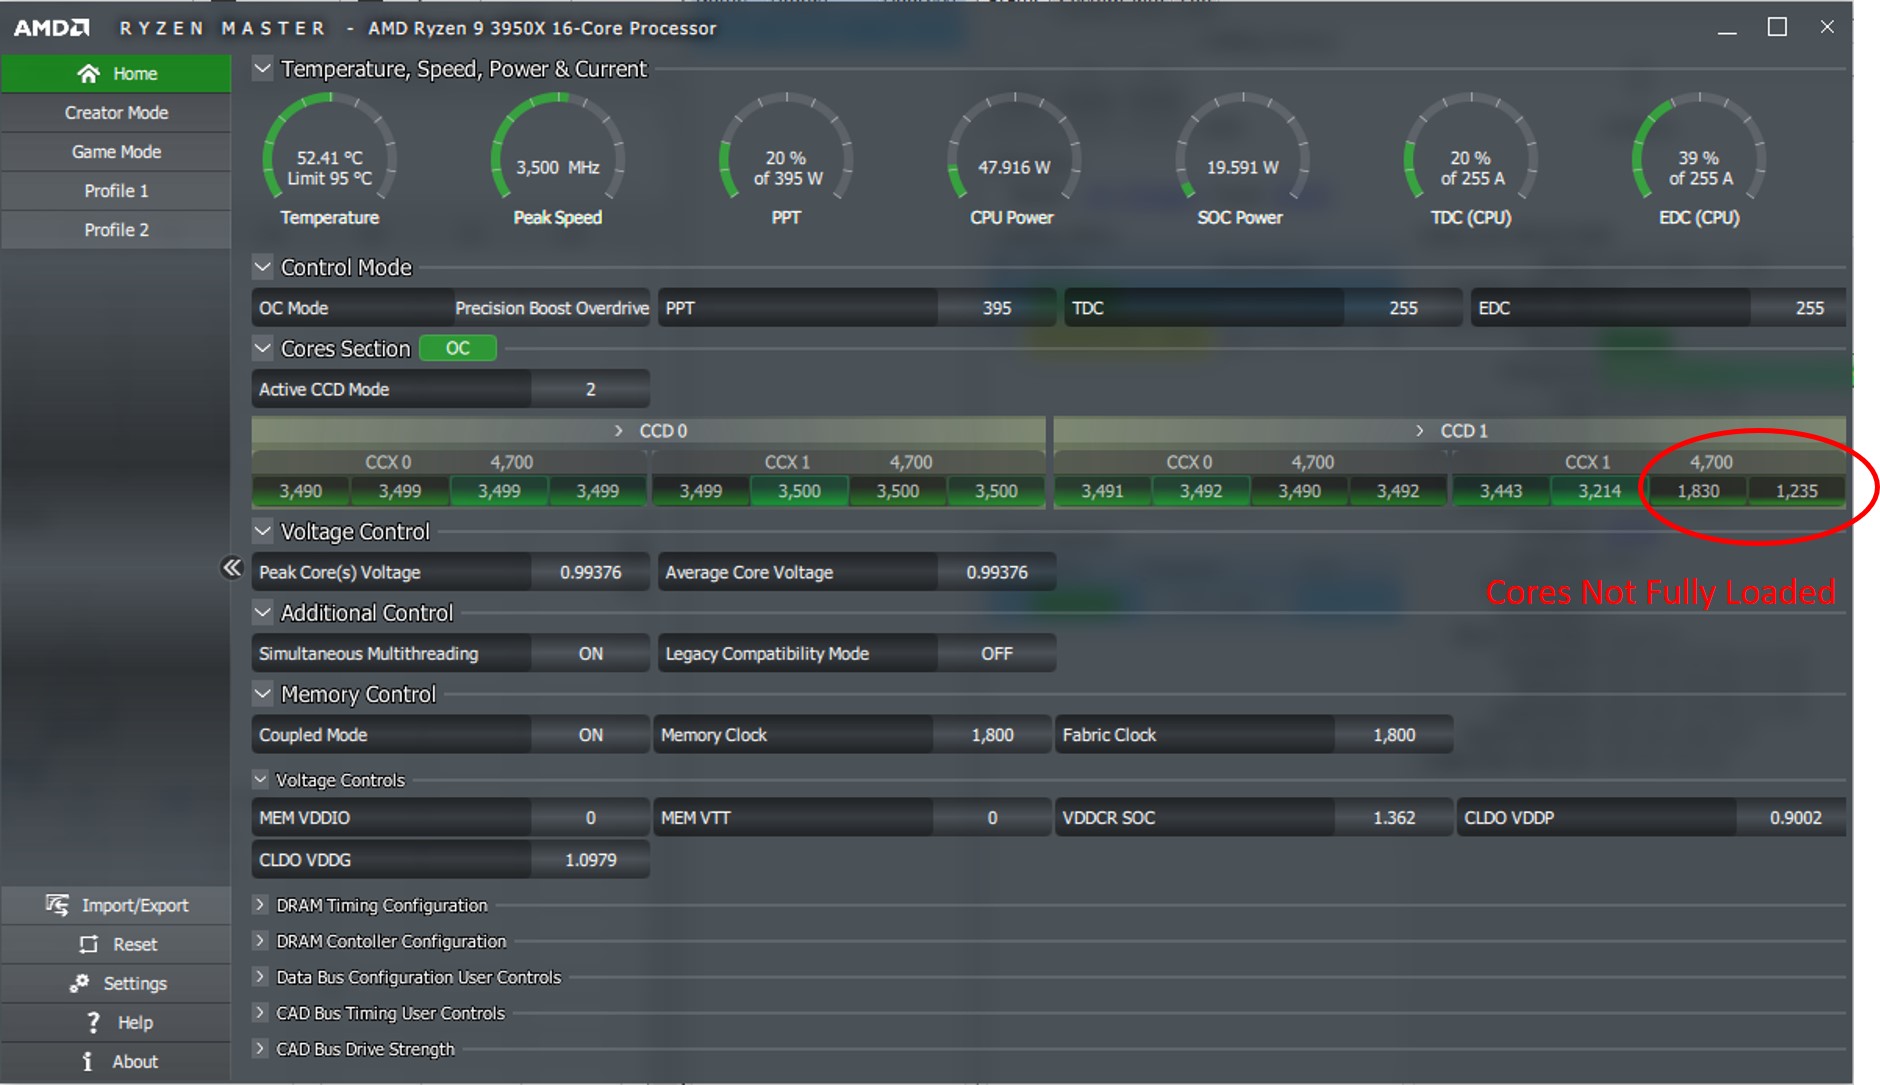
I do have some evidence to back up this theory. Investigating what is going on with Ryzen Master with Folding@Home set to 20 threads is pretty telling.

Since 20 threads exceeds the 16-core capacity of the processor, one would think all 16 cores would be spun up to max in order to get through this work as fast as possible. However, that is not the case. Only 12 cores are clocked up. Now, if you consider SMT, these 12 cores can handle 24 threads of computation. So, virtual cores are being used as well as physical cores to handle this 20-thread job. This obviously isn’t ideal from a performance or an efficiency standpoint, but it makes sense considering what Windows 10 is: a user’s operating system, not a high performance computing operating system. By keeping some physical CPU cores free when it can, Microsoft is hoping to ensure users a smooth computing experience.
Comparison to Previous Results
The above plots are fun and all, but the real juice is the comparison to the previous results. As a reminder, these were covered in detail in these posts:
Performance Comparison
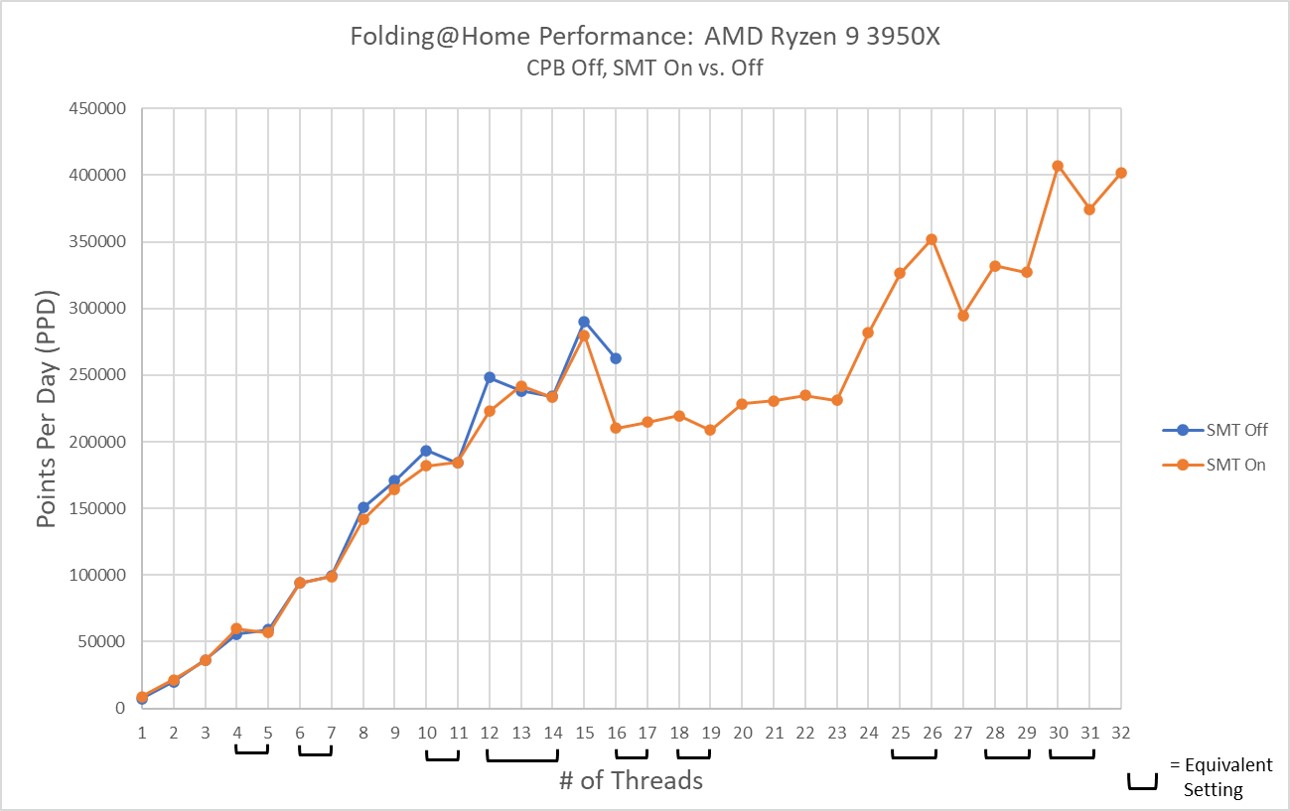
In the previous parts of this article, the difference between SMT (aka Hyperthreading) being on or off was shown to be negligible on the Ryzen 9 3950x in the physical core region (thread count = 16 or less). The major advantage of SMT was it allowed more solver threads to be piled on, which eventually results in increased performance and efficiency for thread counts above 25. In the plot below, the third curve basically shows what the effect of overclocking is. In this case, Core Performance Boost, AMD’s auto-overclocking routine, provides a fairly uniform 10-20 percent improvement. This diminishes for high core count settings though, becoming a nominal 5% improvement above 28 cores. It should be noted that the effects of work unit to work unit variation are still apparent, even with five averages per test case, so don’t try to draw any specific conclusions at any one thread count. Rather, just consider the overall trend.
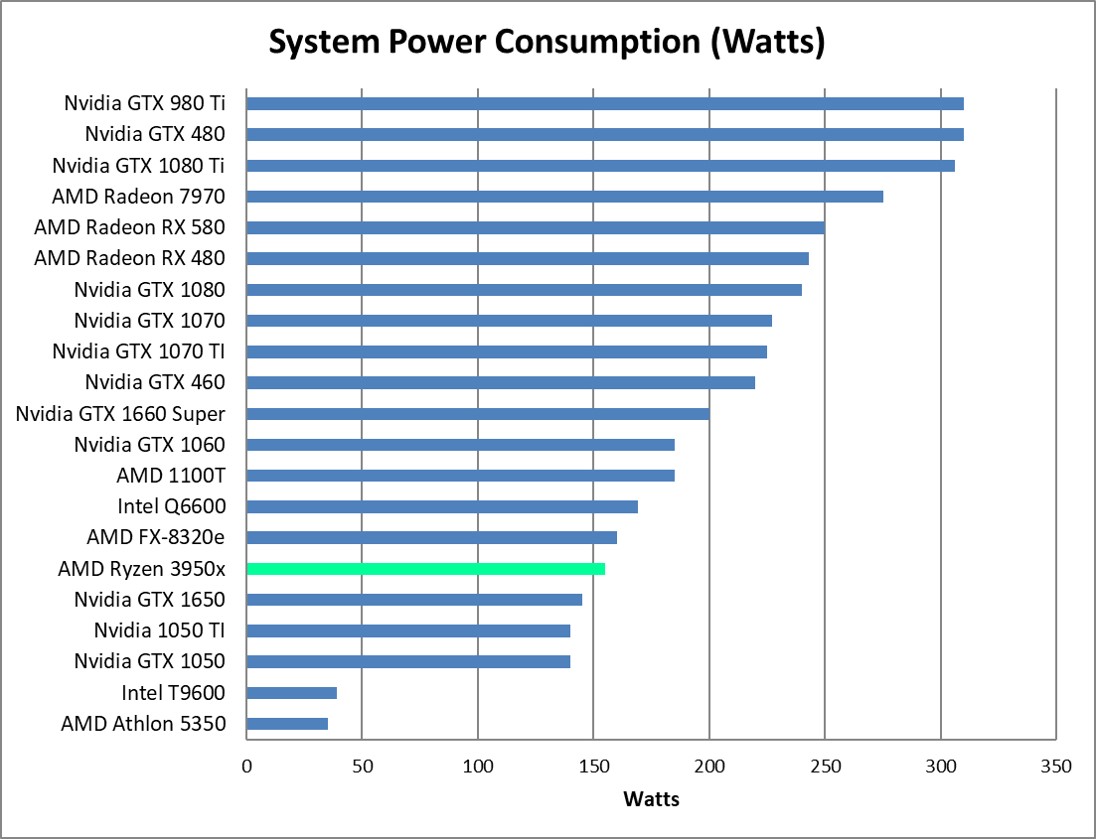
Power Comparison
The power consumption plot shows a MASSIVE difference between wall power being used for the CPB testing vs the other two tests. This shouldn’t come as a surprise. Overclocking a processor’s frequency requires more voltage. Within a given transistor cycle, the Average Voltage * Average Current = Average Power, so for a constant current being supplied to the CPU socket, an increase in voltage increases the power being consumed. This is compounded by the transistor switching frequency going up as well (due to the increased frequency), which also results in a higher average power consumption due to there being more transistor switching activities occurring in a given unit of time.
In short, we are looking at a very noticable increase in your electrical bill to run Folding@Home on an overclocked machine.
Efficiency Comparison
Efficiency is the whole point of this article and this blog, so behold! I’ve shown in previous articles both on CPUs and GPUs that overclocking typically hurts efficiency (and conversely, that underclocking and undervolting improves efficiency). The story doesn’t change with factory automatic overclocking routines like CPB. In the below, it is clear that and here we have a very strong case for disabling Core Performance Boost, since it is up to 25% less efficient when enabled.

Conclusion
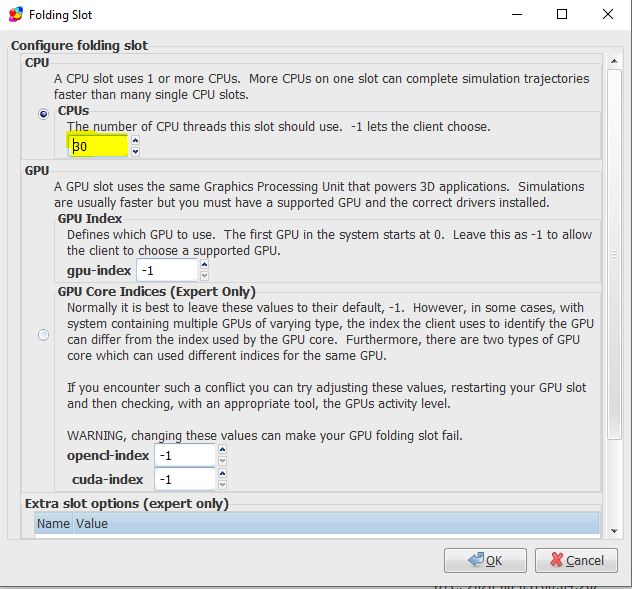
The Ryzen 9 3950x is a very good processor for fighting disease with Folding@Home. The high core count produces exceptional efficiency numbers for a CPU, with a setting of 30 threads being ideal. Leaving 2 threads free for the rest of Windows 10 doesn’t seem to hurt performance or efficiency too much. Given the work unit variation, I’d say that 30 and 32 threads produce the same result on this processor.
As far as optimum settings, to get the most bang for electrical buck (i.e. efficiency), running that 30-thread CPU slot requires SMT to be enabled. Disabling CPB, which is on by default, results in a massive efficiency improvement by cutting over 50 watts off the power consumption. For a dedicated folding computer running 24/7, shaving that 50 watts off the electric bill would save 438 kWh/year of energy. In my state, that would save me $83 annually, and it would also save about 112 lbs of CO2 from being released into the atmosphere. Imagine the environmental impact if the 100,000+ computers running Folding@Home could each reduce their power consumption by 50 watts by just changing a setting!
Future Work
If there is one thing to be said about overclocking a Ryzen 3xxx-series processor, it’s that the possibilities are endless. A downside to disabling CPB is that if you aren’t folding all the time, your processor will be locked at its base clock rate, and thus your single-threaded performance will suffer. This is where things like PBO come in. PBO = Precision Boost Overdrive. This is yet another layer on top of CPB to fine-tune the overclocking while allowing the system to run in automatic mode (thus adapting to the loads that the computer sees). Typically, people use PBO to let the system sustain higher clock rates than standard CPB would allow. However, PBO also allows a user to enter in power, thermal, and voltage targets. Theoretically, it should be possible to set up the system to allow frequency scaling for low CPU core counts but to pull down the power limit for high core-counts, thus giving a boost to lightly threaded jobs while maintaining high core count efficiency. This is something I plan to investigate, although getting comparable results to this set of plots is going to be hard due to the prevalence of the new AVX2 enabled work units.
Maybe I’ll just have to do it all over again with the new work units? Sigh…