
Welcome back everyone. Over the last month, I’ve been experimenting with my new Folding@Home benchmark machine to see how effectively AMD’s flagship Ryzen processor (Ryzen 9 3950X) can fight diseases such as COVID-19, Cancer, and Alzheimer’s. I’ve been running Folding@Home, a charitable distributed computing project, which provides scientists with valuable computing resources to study diseases and learn how to combat them.
This blog is typically focused on energy efficiency, where I try to show how to do the most science for the least amount of power consumption possible. In this post, I’m stepping away from that (at least for now) in order to understand something much simpler: how does the Folding@Home CPU client scale with # of processor threads?
I’d previously investigated Folding@Home performance and efficiency vs. # of CPU cores on an old Intel Q6600. I’ve also done a few CPU articles on AMD’s venerable Phenom II X6 1000T and my previous processor, the AMD FX-8320e. These CPU articles were few and far-between however, as I typically focus on using graphics cards (GPUs). The reason is twofold. Historically, graphics cards have produced many more points per day (PPD) for a given amount of power, thanks to their massively parallel architecture, which is well-suited for running single precision molecular dynamics problems such as those used by Folding@Home. Also, graphics cards are much easier to swap out, so it was relatively easy to make a large database of GPU performance and efficiency.
Still, CPU folding is just as important, because there are certain classes of problems that can only be efficiently computed on the CPU. Folding@Home, while originally a project that ran exclusively on CPUs, obtains the bulk of its computational power from GPU donors these days. However, the CPU folders sill play a key part, running work units that cannot be solved on GPUs, thus providing a complete picture of the molecular dynamics.
In my last article, I highlighted the need for me to build a new benchmark machine for testing out GPUs, since my old rig would soon become a bottleneck and slow the GPUs down (thus potentially affecting any comparison plots I make). Now that this Ryzen-based 16-core monster of a desktop is complete, I figured I’d revisit CPU folding once more to see just what a modern enthusiast-class processor like the $749 Ryzen 9 3950X is capable of. For this first part of a multi-part review, I am simply looking at the preliminary results from running Folding@Home on the CPU. Instead of running with the default thread settings, I manually set up the client, examining just how performance results scale from the 1 to 32 available threads on the Ryzen 9 3950x.
Test Setup
Testing was performed in Windows 10 Home, using the latest Folding@Home client (7.6.13). Points Per Day were estimated from the client window for each setting of # of CPU threads. These instantaneous estimates have a lot of variability, so future testing will investigate the effect of averaging (running multiple tests at each setting) on the results.
Benchmark Machine Hardware:
| Case | Raidmax Sagitta (2006) |
| Power Supply | Seasonic Prime 750 Titanium |
| Fresh Air | 2 x 120 mm Enermax Front Intake |
| Rear Exhaust | 1 x 120 mm Scythe Gentile Typhoon |
| Side Exhaust | 1 x 80 mm Noctua |
| Top Exhaust | 1 x 120 mm (Seasonic PSU) |
| CPU Cooler | Noctua NH-D15 SE AM4 |
| Thermal Paste | Arctic MX-4 |
| CPU | AMD Ryzen 9 3950X 16 Core 32 Thread (105W TDP) |
| Motherboard | ASUS Prime X570-P Socket AM4 |
| Memory | 32 GB (4 x 8 GB) Corsair Vengeance LPX DDR4 3600 MHz |
| GPU | Zotac Nvidia GeForce 1650 |
| OS Drive | Samsung 970 Evo Plus 512 GB NVME SSD |
| Storage #1 | Samsung 860 Evo 2 TB SSD |
| Storage #2 | Western Digital Blue 256 GB NVME SSD (for Linux) |
| Optical | Samsung SH-B123L Blu-Ray Drive |
| OS | Windows 10 Home, Ubuntu Linux (on 2nd NVME) |
Processor Settings:
The AMD Ryzen 9 3950x is a beast. With 16 cores and 32 threads, it has a nominal power consumption of 105 watts, but can easily double that when overclocked. With the factory Core Performance Boost (CPB) enabled, the processor will routinely draw 150+ watts when loaded due to the individual cores turboing as high as 4.7 GHz, up from the 3.5 GHz base clock. Under heavy multi-threaded work loads, the processor supports an all-core overclock of up to 4.3 GHz, assuming sufficient cooling and motherboard power delivery.
This automatic core turbo behavior is problematic for creating a plot of folding at home performance (PPD) vs # of threads, since for lightly threaded loads, the processor will scale up individual cores to much higher speeds. In order to make an apples to apples comparison, I disabled CPB, so that all CPU cores run at the base speed of 3.5 GHz when loaded. In future testing, I will perform this study with CPB on in order to see the effect of the factory automatic overclocking.
A note about Cores vs. Threads
Like many Intel processors with Hyper-Threading, AMD supports running multiple code execution strings (known as threads) on one CPU core. The Simultaneous Multi-Threading (SMT) on the Ryzen 9 3950x is simply AMD’s term for the same thing: a doubling of certain parts within each processor core (or sometimes the virtualization of multiple threads within one CPU core) to allow multiple thread execution (two threads per core, in this case). The historical problem with both Hyper-Threading and SMT is that it does not actually double a CPU core’s capacity to perform complex floating point mathematics, since there is only one FPU per CPU core. SMT and Hyperthreading work best when there is one large job hogging a core, and the smaller job can execute in the remaining part of the core as a second thread. Two equally intensive threads can end up competing for resuorses within a core, making the SMT-enabled processor actually slower. For example: https://www.techspot.com/review/1882-ryzen-9-smt-on-vs-off/
For the purposes of this article, I left SMT on in order to make the coolest plot possible (1-32 threads!). However, I suspect that SMT might actually hurt Folding@Home performance, for the reasons mentioned above. Thus in future testing, I will also try disabling this to see the effect.
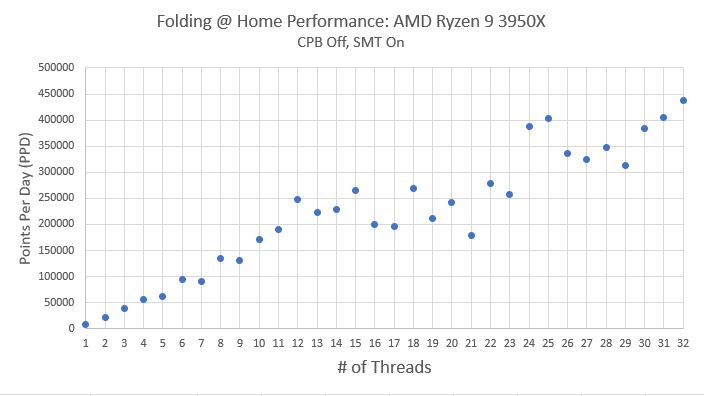
Preliminary Results: PPD vs # Threads on Ryzen 9 3950x
So, to summarize the caveats, this test was performed once under each test condition (# of threads), so there are 32 data points for 32 threads. SMT was on (so Folding@Home can run two threads on one CPU core). CPB was off (all cores set to 3.5 GHz).
The figure below shows the results. As you can see, there is a general trend of increasing performance with # of threads, up to around the halfway point. Then, the trend appears to get messy, although by the end of the plot, it is clear that the higher thread counts realize a higher PPD.
Observations
It is clear that, at least initially, adding threads to the solution makes a fairly linear improvement in points per day. Eventually, however, the CPU cores are likely becoming saturated, and more of the work is being executed in via SMT. Due to the significant work unit variability in Folding@Home (as much as 10-20% between molecules), these results should be taken with a grain of salt. I am currently re-running all of these tests, so that I can show a plot of average PPD vs. # of Threads. I am also logging power using my watt meter, so that we can make wall power consumption and efficiency plots.
Conclusions
Seeing a processor produce nearly half a million points per day in Folding@Home was insane! My previous testing with old 4, 6, and 8-core processors was lucky to show numbers over 20K PPD. In general, allowing Folding@Home to use more processor threads increases performance, but there is significant additional work needed to verify a statistical trend. Stay tuned for Part II (averaging).
P.S.
Man, that’s a lot of cores! You’d better be scared, COVID-19…I’m coming for you!
So Many Cores!

Very interesting results. I’m running with 12 threads on an 8-core, 16-thread processor, but haven’t done any analysis, so this was a good read. I’m looking forward to more of your results w..r.t. both SMT and CPB. Thanks.
Hi Chris,
this is a great post that in a certain way answers my questions, eager to read part 2 :).
From what I can see here in that case having 1wu for 8 cores times 4 would be way much more producing in terms of PPD, from your graph with 32 cores we can read roughly 450000, with 8 cores roughly 150000. I would assume that working on 4 wu simultaneously with 8 cores each would produce roughly 600000!?
What is your feeling about that?
Regards
Loïc
I think the problem will be it won’t scale well past engaging 16 threads (due to only having 16 real cores). If this were a true 32 core processor, I expect the score at 32 work units would have been closer to 1 million PPD (curve having a concave slope facing upwards). As it is, resources become starved as the hyperthreads compete for FPU access on the cores at higher thread counts. I think I’ll just end up testing it to prove this out!
If the 3950x had 32 “real” cores you would likely be correct, but it only has 16 cores with 32 threads. Chris is probably getting 8 separate CPUs when running 8 threads, but that result wouldn’t scale.
I have been folding on a 3950X for the past month as well. My numbers line up pretty closely with what you are seeing. I didn’t care for how warm my CPU would get with boost so I turned it off. When I turned it off, I was running 7 threads(1 dedicated to my GPU) and I saw about a 20% decrease in PPD, but a 20C decrease in CPU temp. I’m running a Corsair H110i cooler and was honestly shocked at how hard boost would push the CPU from a power perspective.
Yes I’ve found the same thing. Core performance boost is really designed to help clear lightly-threaded workloads quickly and then let the computer get back to an idle state. It makes it feel much faster for the user. For high performance computing (HPC), where the work never stops, it just ends up baking the CPU by running it in an overclocked / overvolted state constantly. This is hard on the power bill and the hardware, and sacrifices efficiency for pure speed. I will do a test where I re-enable CPB on the 3950x and see how much more work it does (and how much less efficiently it does it).
Pingback: AMD Ryzen 9 3950X Folding@Home Review: Part 2: Averaging, Efficiency, and Variation | Green Folding@Home
Pingback: AMD Ryzen 9 3950X Folding@Home Review: Part 3: SMT (Hyperthreading) | Green Folding@Home