A while ago, I wrote a pair of articles on why it’s important to consider the energy efficiency of your computer’s power supply. Those articles showed how maximizing the efficiency of your Power Supply Unit (PSU) can actually save you money, since less electricity is wasted as heat with efficient power supplies.
Efficient Power Supplies: Part 1
Energy Efficient Power Supplies: Part 2
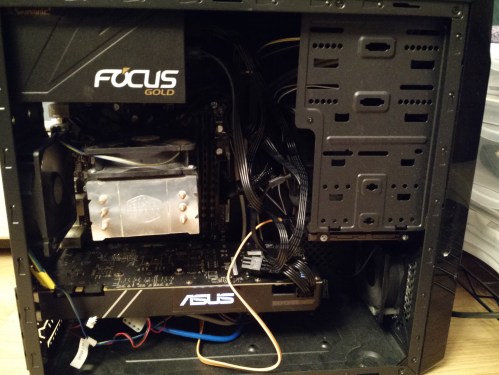
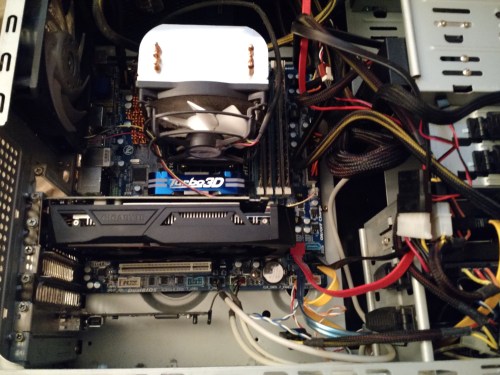
In this article, I’m putting this into practice, because the PSU in my Ubuntu folding box (Codenamed “Voyager”) is on the fritz.
This PSU is a basic Seasonic S12 III, which is a surprisingly bad power supply for such a good company as Seasonic. For one, it uses a group regulated design, which is inherently less efficient than the more modern DC-DC units. Also, the S12 is prone to coil whine (mine makes tons of noise even when the power supply is off). Finally, in my case, the computer puts a bunch of feedback onto the electrical circuits in my house, causing my LED lights to flicker when I’m running Folding@Home. That’s no good at all! Shame on you, Seasonic, shame!
Don’t believe me on how bad this PSU is? Read reviews here:
https://www.newegg.com/seasonic-s12iii-bronze-series-ssr-500gb3-500w/p/N82E16817151226
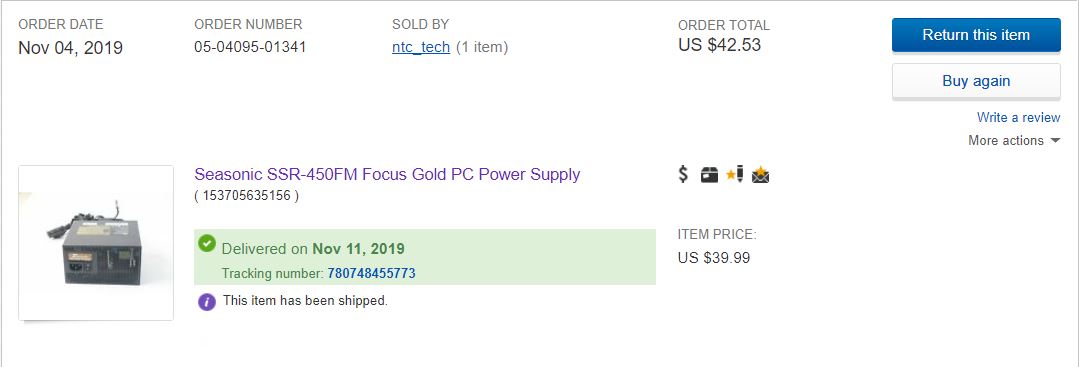
Now, I love Seasonic in general. They are one of the leading PSU manufactures, and I use their high-end units in all of my machines. So, to replace the S12iii, I picked up one of their midrange PSU’s in the Focus line…specifically, the Focus Gold 450. I got a sweet deal on eBay (got a used one for about $40, MSRP new on the SSR-450FM is $80).
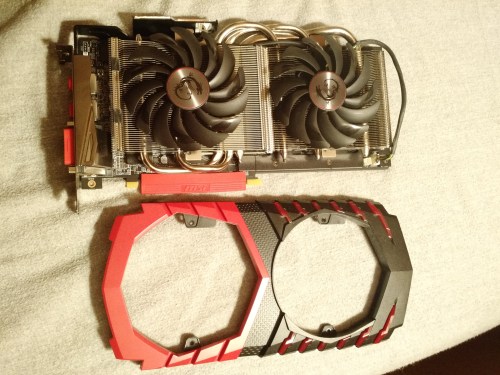
Here they are side by side. One immediate advantage of the new Focus PSU is that it is semi-modular, which will help me with some cable clutter.
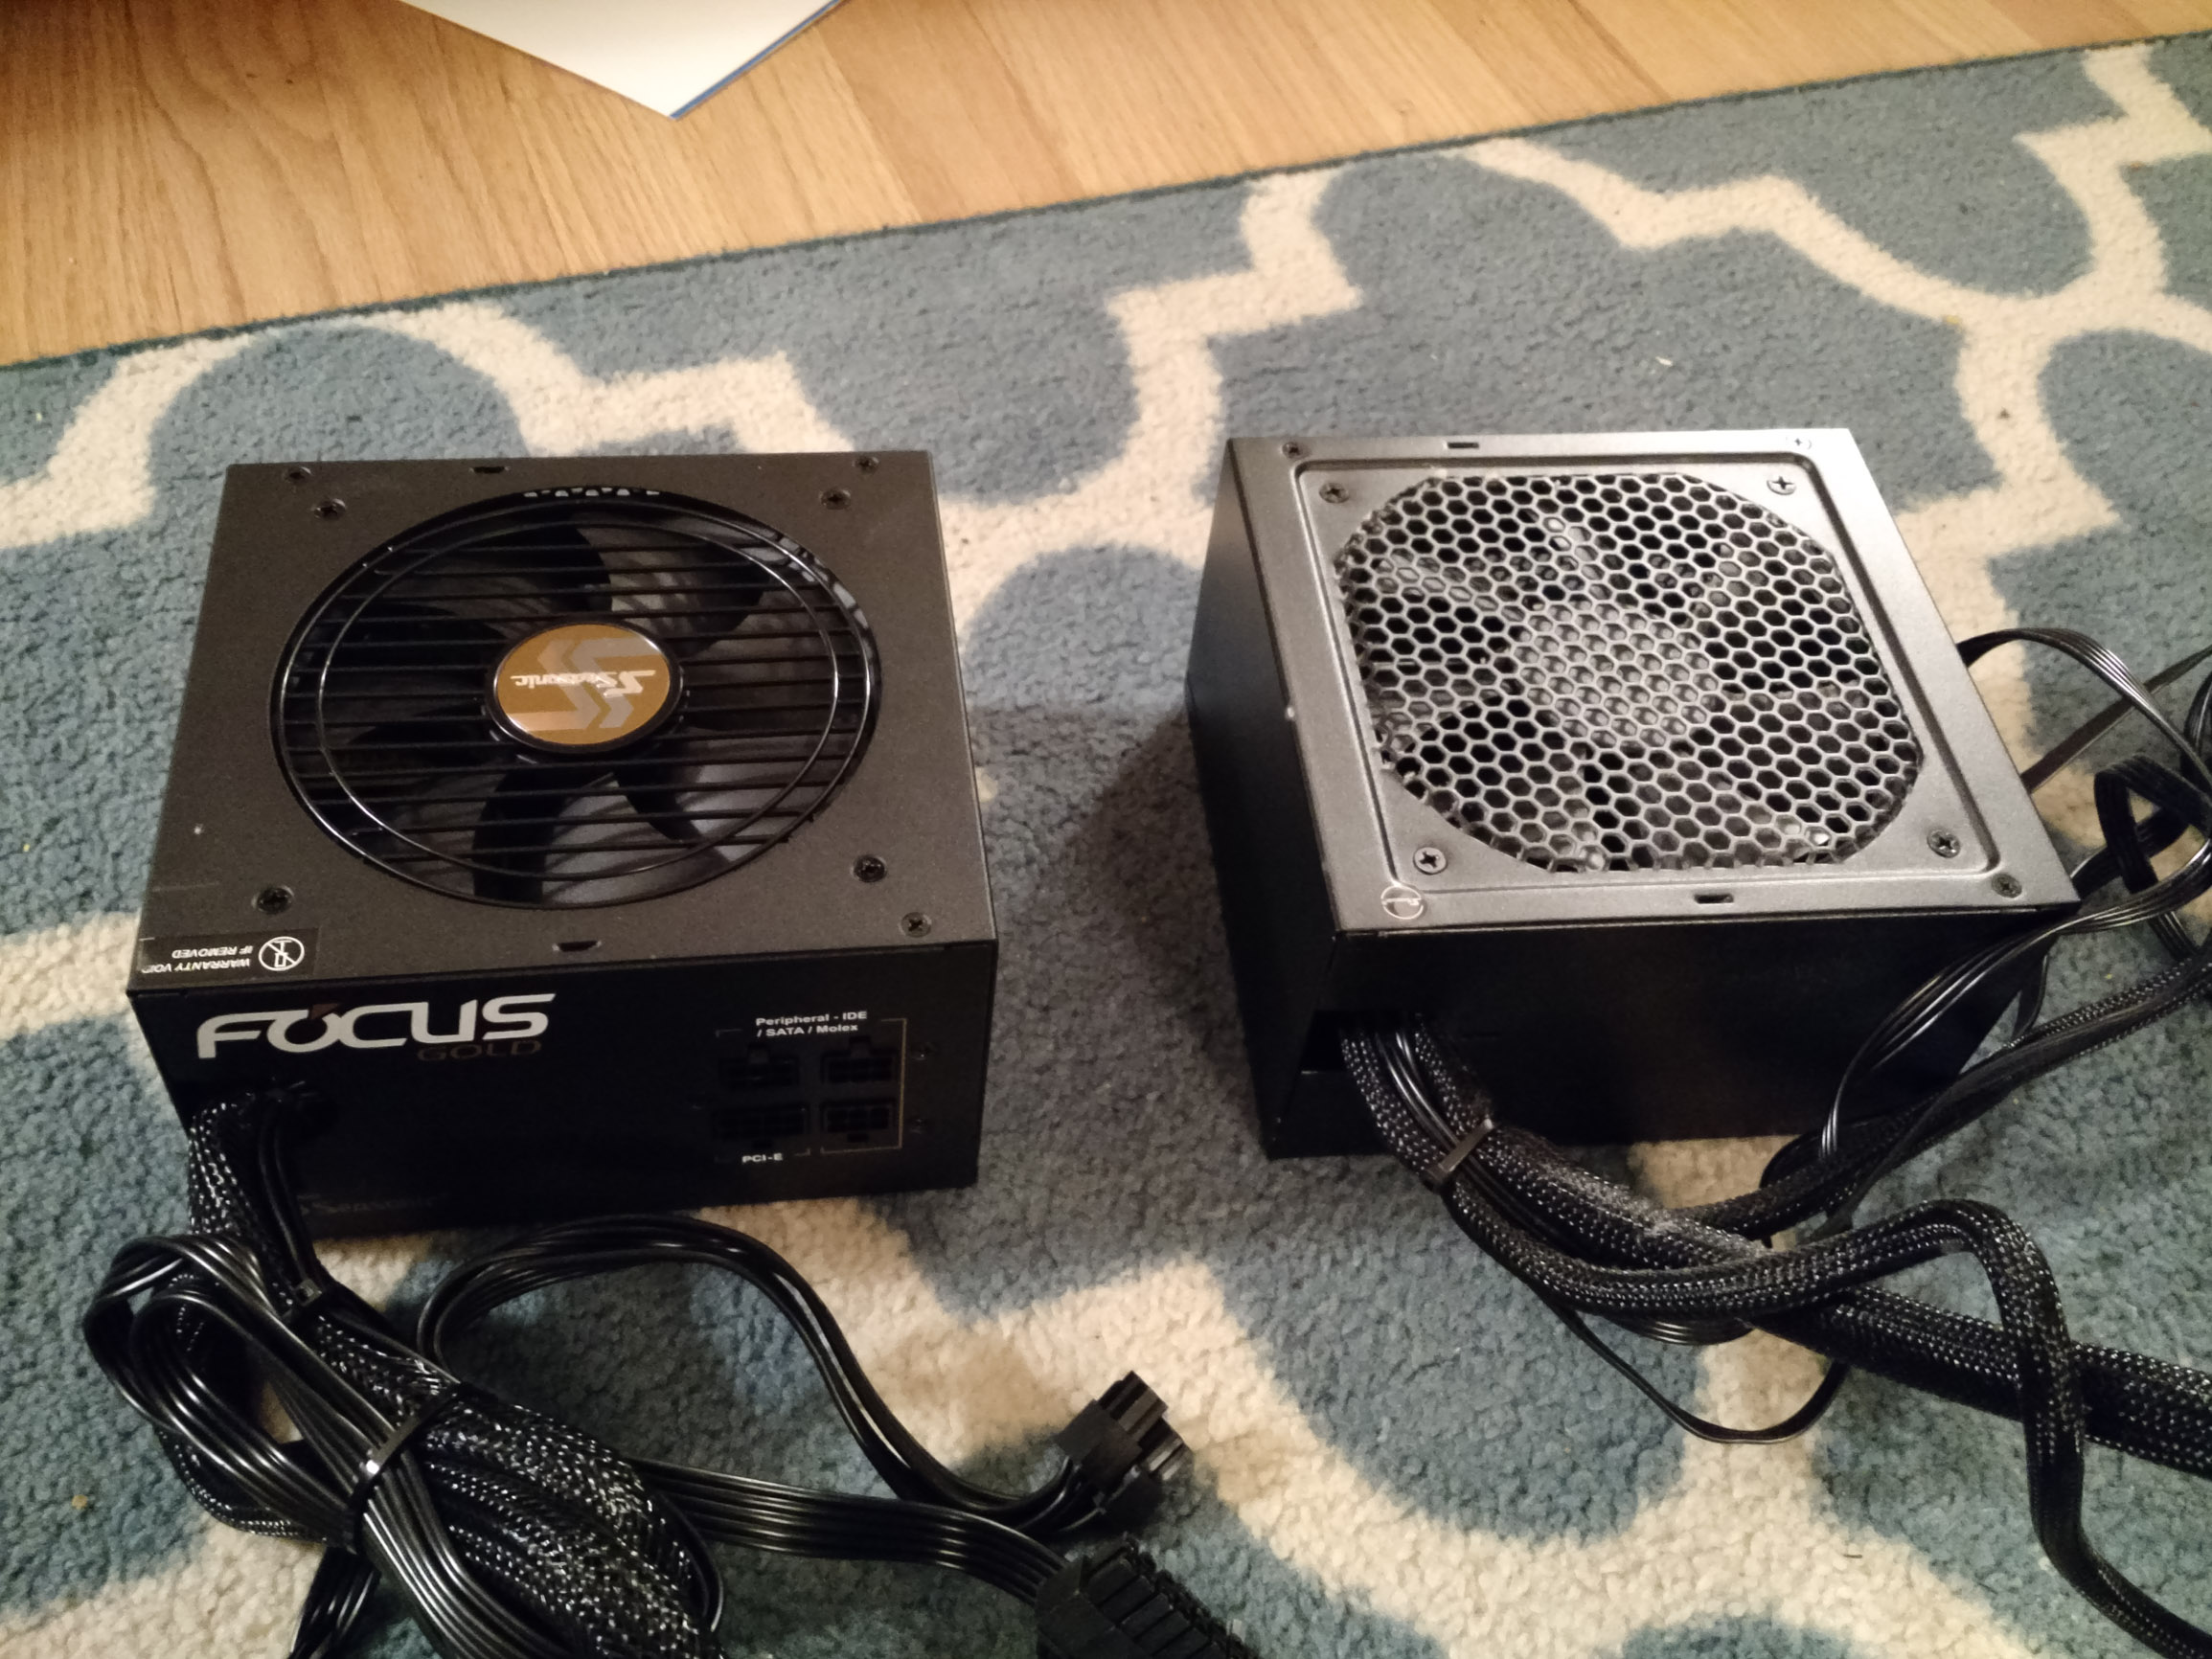
Seasonic PSU Comparison: Focus Gold 450W (left) vs S12iii 500W (right)
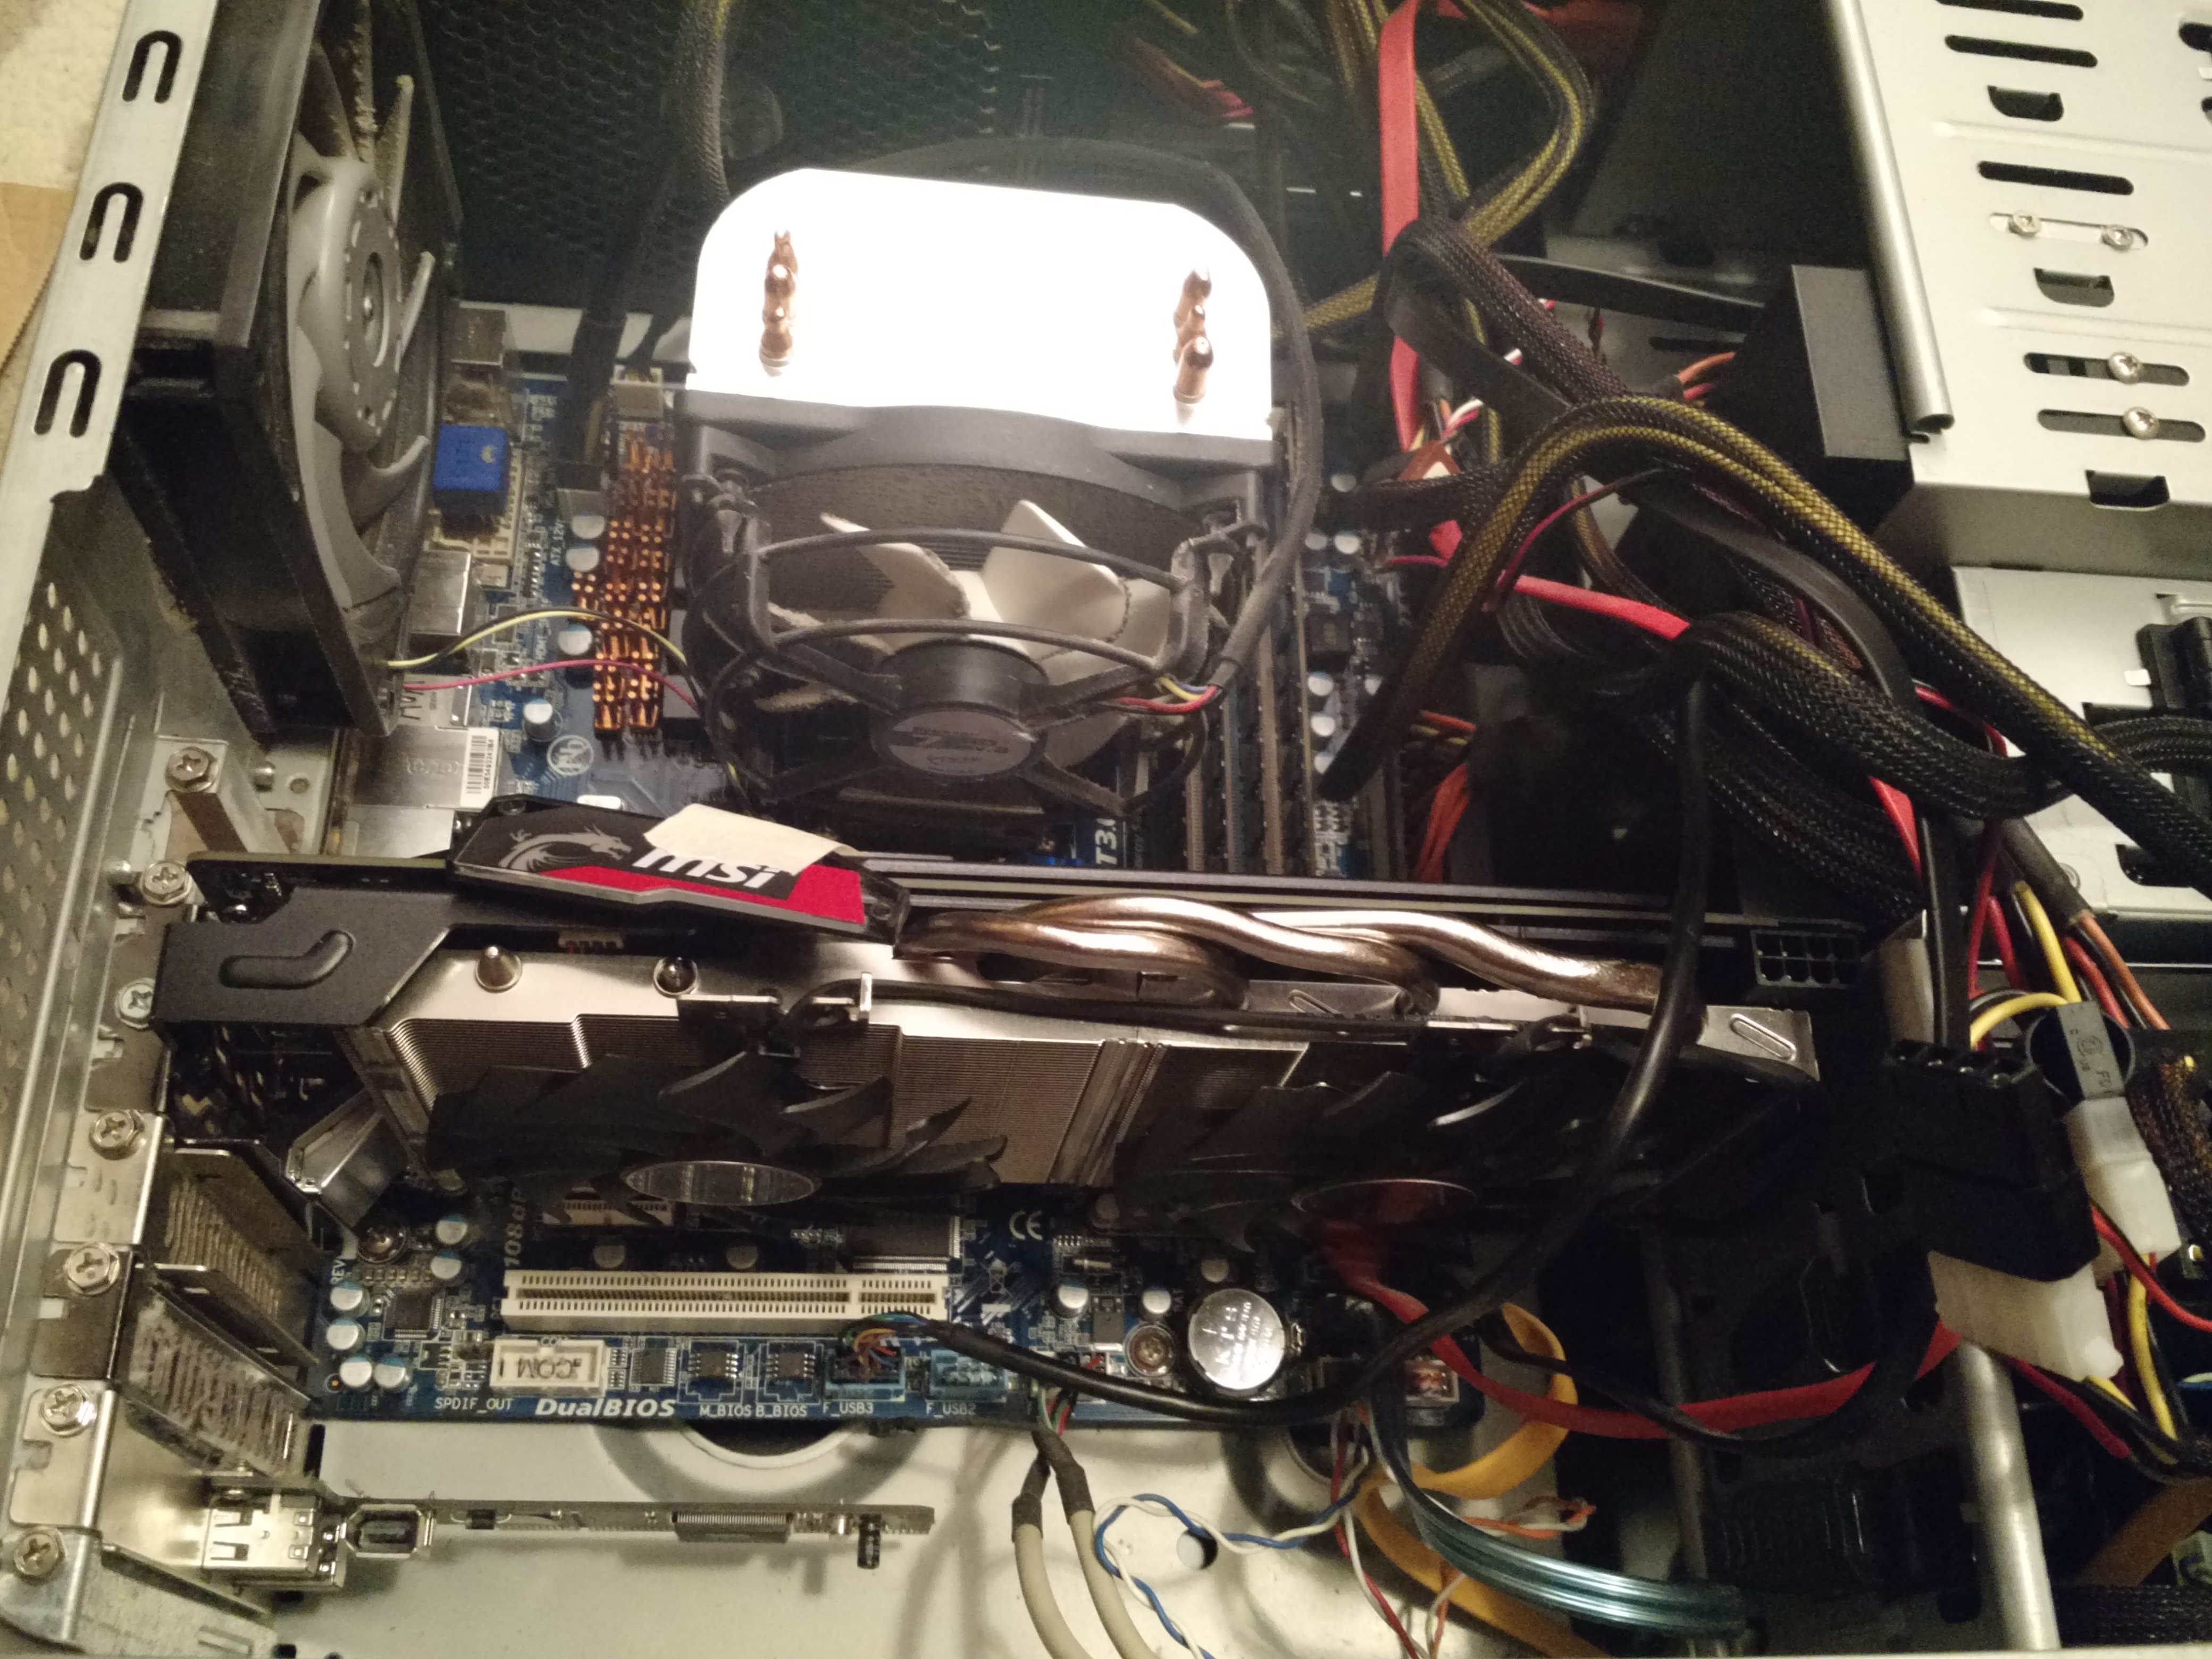
Inspecting the specification labels also shows a few differences…namely the Focus is a bit less powerful (three less amps on the +12v rail), which isn’t a big deal for Voyager, since it is only running a single GeForce 1070 Ti card (180 Watt TDP) and an AMD A10-7700K (95 Watt TDP). Another point worth noting is the efficiency…whereas the S12iii is certified to the 80+ Bronze standard, the new Focus unit is certified as 80+ Gold.


Now this is where things get interesting. Voyager has a theoretical power draw of about 300 Watts max (180 Watts for the video card, 95 for the CPU, and about 25 Watts for the motherboard, ram, and drives combined). This is right around the 60% capacity rating of these power supplies. Here is the efficiency scorecard for the various 80+ certifications:
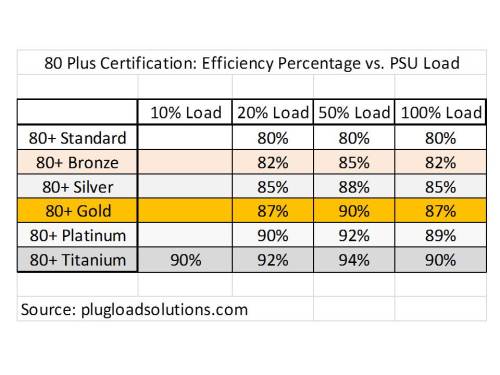
80+ Efficiency Table
As you can see, there is about a 5% improvement in efficiency going from 80+ bronze to 80+ gold. For a 300 watt machine, that would equate to 15 watts of difference between the Focus and the S12iii PSU’s. By upgrading to the Focus, I should more effectively turn the 120V AC power from my wall into 12V DC to run my computer, resulting in less total power draw from the wall (and less waste heat into my room).
I tested it out, using Stanford’s Folding@Home distributed computing project of course! Might as well cure some cancer, you know!
The Test
To do this test, I first let Voyager pull down a set of work units from Stanford’s server (GPU + CPU folding slots enabled). When the computer was in the middle of number crunching, I took a look at the instantaneous power consumption as measured by my watt meter:
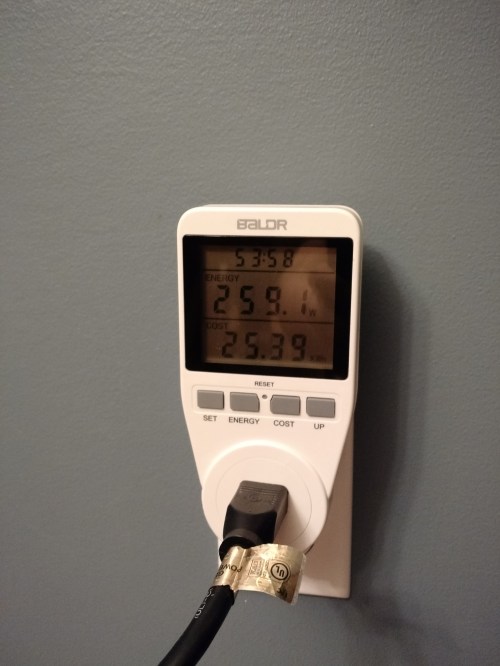
80+ Bronze PSU: 259.1 Watts @ Full Load
260 Watts is about the max I ever see Voyager draw in practice, since Folding@Home never fully loads the hardware (typically it can hit the GFX card for about 90% capacity). So, this result made perfect sense. Next, I shut the machine down with the work units half-finished and swapped out the 80+ Bronze S12iii for the 80+ Gold Focus unit. I turned the machine back on and let it get right back to doing science.
Here is the updated power consumption number with the more efficient power supply.
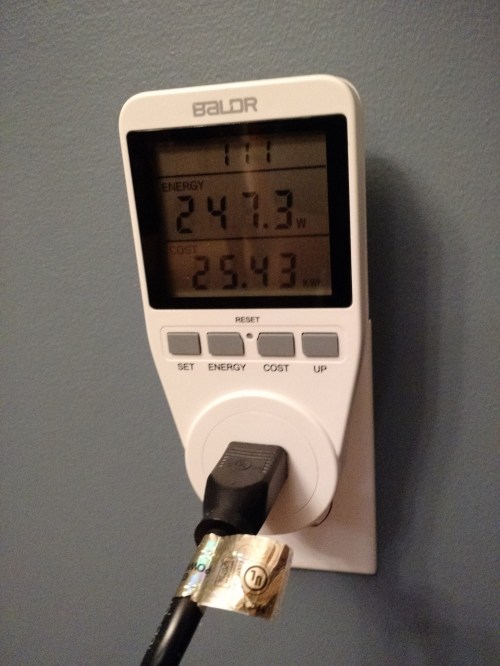
80+ Gold PSU Power Consumption @ 100% Load
As you can see, the 80+ Gold Rated power supply shaved 11.8 watts off the top. This is about 4.5% of the old PSU unit’s previous draw, and it is about 4.8% of the new PSU unit’s power draw. So, it is very close to the advertised 5% efficiency improvement one would expect per the 80+ specifications. Conclusion: I’m saving electricity and the planet! Yay!
As a side note, all the weird coil whine and light flickering issues I was having with the S12iii went away when I switched to Seasonic’s better Focus PSU.
But, Was It Worth It?
Now, as an environmentalist, I would say that this type of power savings is of course worth it, because it’s that much less energy wasted and that much less pollution. But, we are really talking about just a few watts (albeit on a machine that is trying to cure cancer 24/7 for years on end).
To get a better understanding of the financial implications of my $40 upgrade, I did a quick calc in Excel, using Connecticut’s average price of electricity as provided by Eversource ($0.18 per KWH).
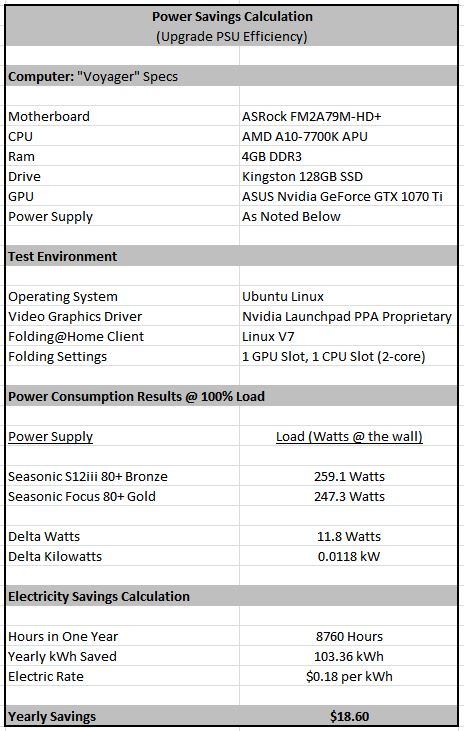
Voyager PSU Efficiency Upgrade Calc
Performing this calculation is fairly straightforward. Basically, it’s just taking the difference in wattage between the two power supply units and turning that into energy by multiplying it by one year’s worth of run time (Energy = Power * Time). Then, I multiply that out by the cost of energy to get a yearly cost savings of about $20 bucks. That’s not bad! Basically, I could pay for my PSU upgrade in two years if I run the machine constantly.
Things get better if I sell the old PSU. Getting $20 for a Seasonic anything should be easly (ignoring the moral dilemma of sticking someone with a shitty power supply that whines and makes their lights flicker). Then, I’d recoup my investment in a year, all while saving the planet!
So, from my perspective as someone who runs the computer 24/7, this power supply efficiency upgrade makes a lot of sense. It might not make as much sense for people whose computers are off for most of the day, or for computers that just sit around idle, because then it would take a lot longer to recover the costs.
P.S. Now when I pop the side panel off Voyager, I am reminded to focus…