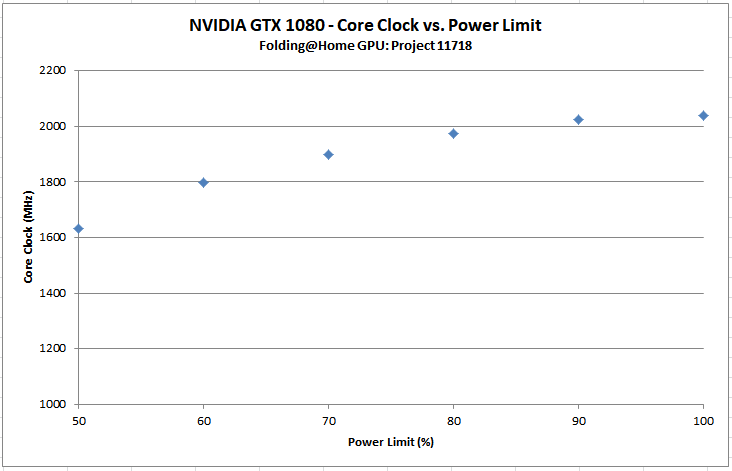
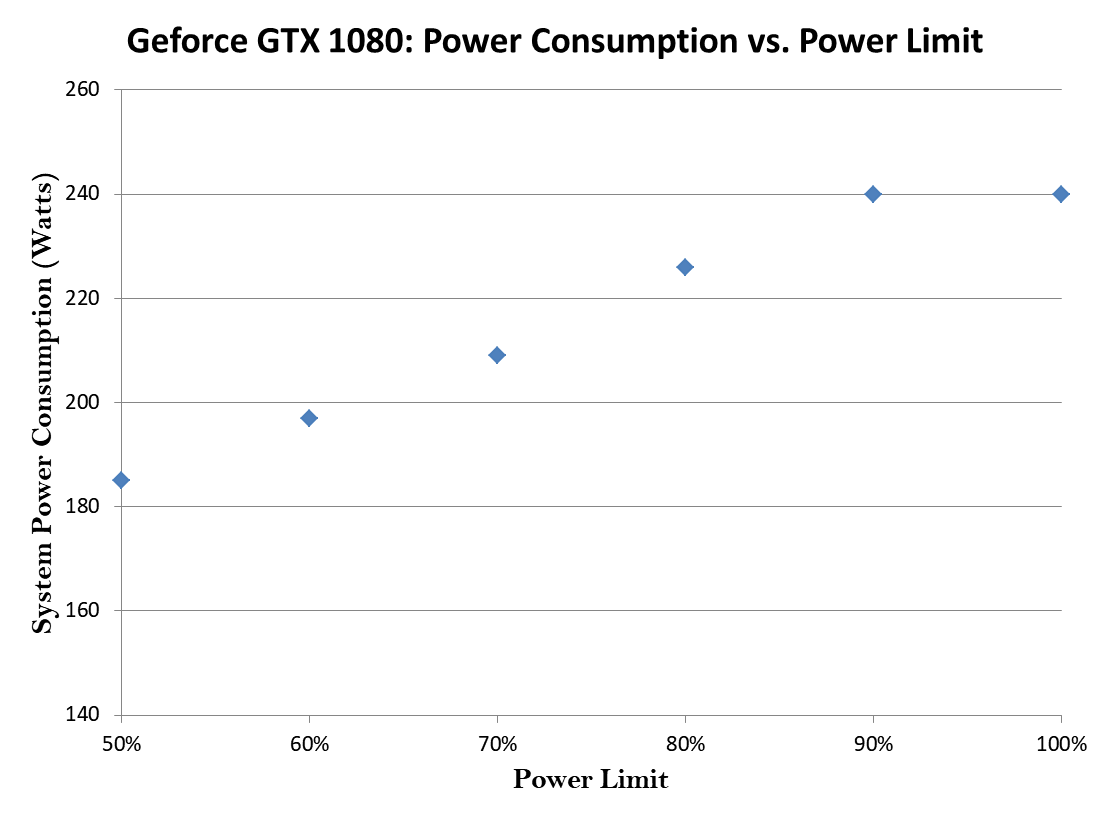
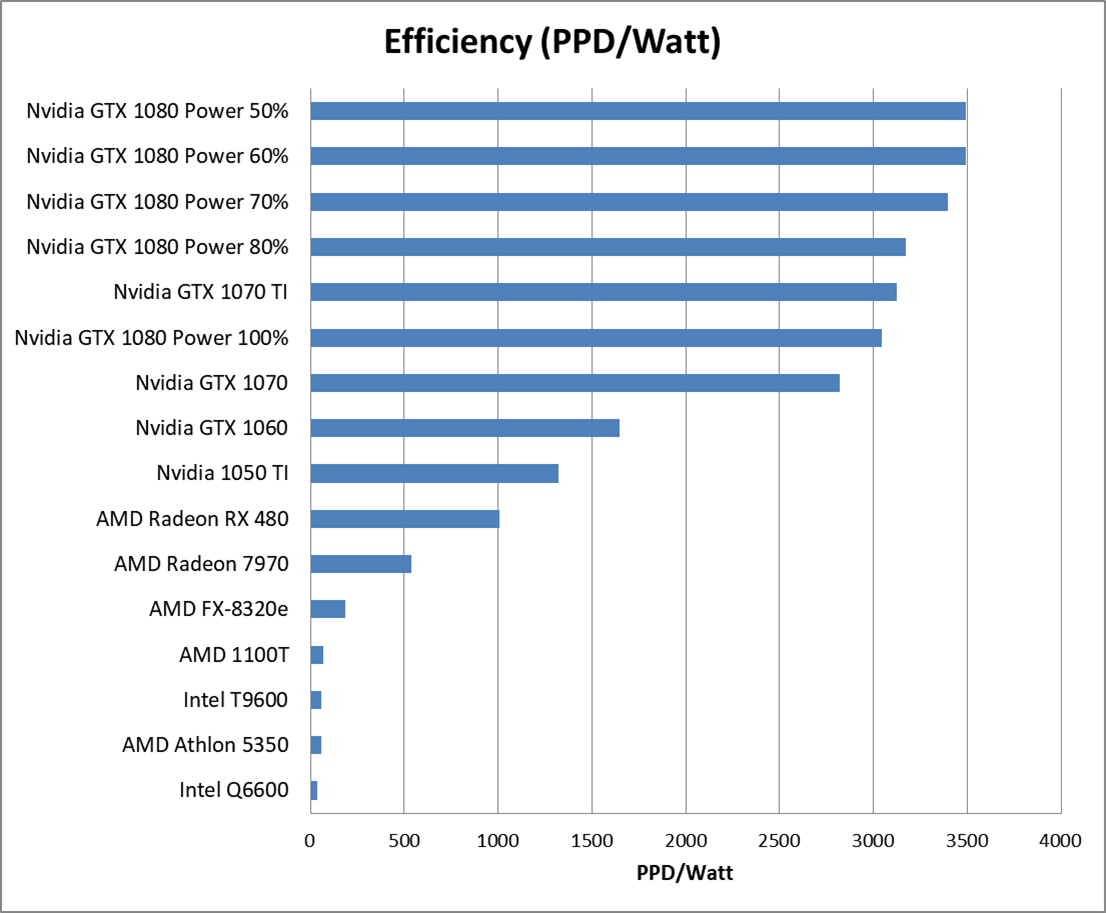
In the last article, I investigated how the power limit setting on an Nvidia Geforce GTX 1080 graphics card could affect the card’s performance and efficiency for doing charitable disease research in the Folding@Home distributed computing project. The conclusion was that a power limit of 60% offers only a slight reduction in raw performance (Points Per Day), but a large boost in energy efficiency (PPD/Watt). Two articles ago, I looked at the effect of GPU core clock. In this article, I’m experimenting with a different variable. Namely, the memory clock rate.
The effect of memory clock rate on video games is well defined. Gamers looking for the highest frame rates typically overclock both their graphics GPU and Memory speeds, and see benefits from both. For computation projects like Stanford University’s Folding@Home, the results aren’t as clear. I’ve seen arguments made both ways in the hardware forums. The intent of this article is to simply add another data point, albeit with a bit more scientific rigor.
The Test
To conduct this experiment, I ran the Folding@Home V7 GPU client for a minimum of 3 days continuously on my Windows 10 test computer. Folding@Home points per day (PPD) numbers were taken from Stanford’s Servers via the helpful team at https://folding.extremeoverclocking.com. I measured total system power consumption at the wall with my P3 Kill A Watt meter. I used the meter’s KWH function to capture the total energy consumed, and divided out by the time the computer was on in order to get an average wattage value (thus eliminating a lot of variability). The test computer specs are as follows:
Test Setup Specs
- Case: Raidmax Sagitta
- CPU: AMD FX-8320e
- Mainboard : Gigabyte GA-880GMA-USB3
- GPU: Asus GeForce 1080 Turbo
- Ram: 16 GB DDR3L (low voltage)
- Power Supply: Seasonic X-650 80+ Gold
- Drives: 1x SSD, 2 x 7200 RPM HDDs, Blu-Ray Burner
- Fans: 1x CPU, 2 x 120 mm intake, 1 x 120 mm exhaust, 1 x 80 mm exhaust
- OS: Win10 64 bit
- Video Card Driver Version: 372.90
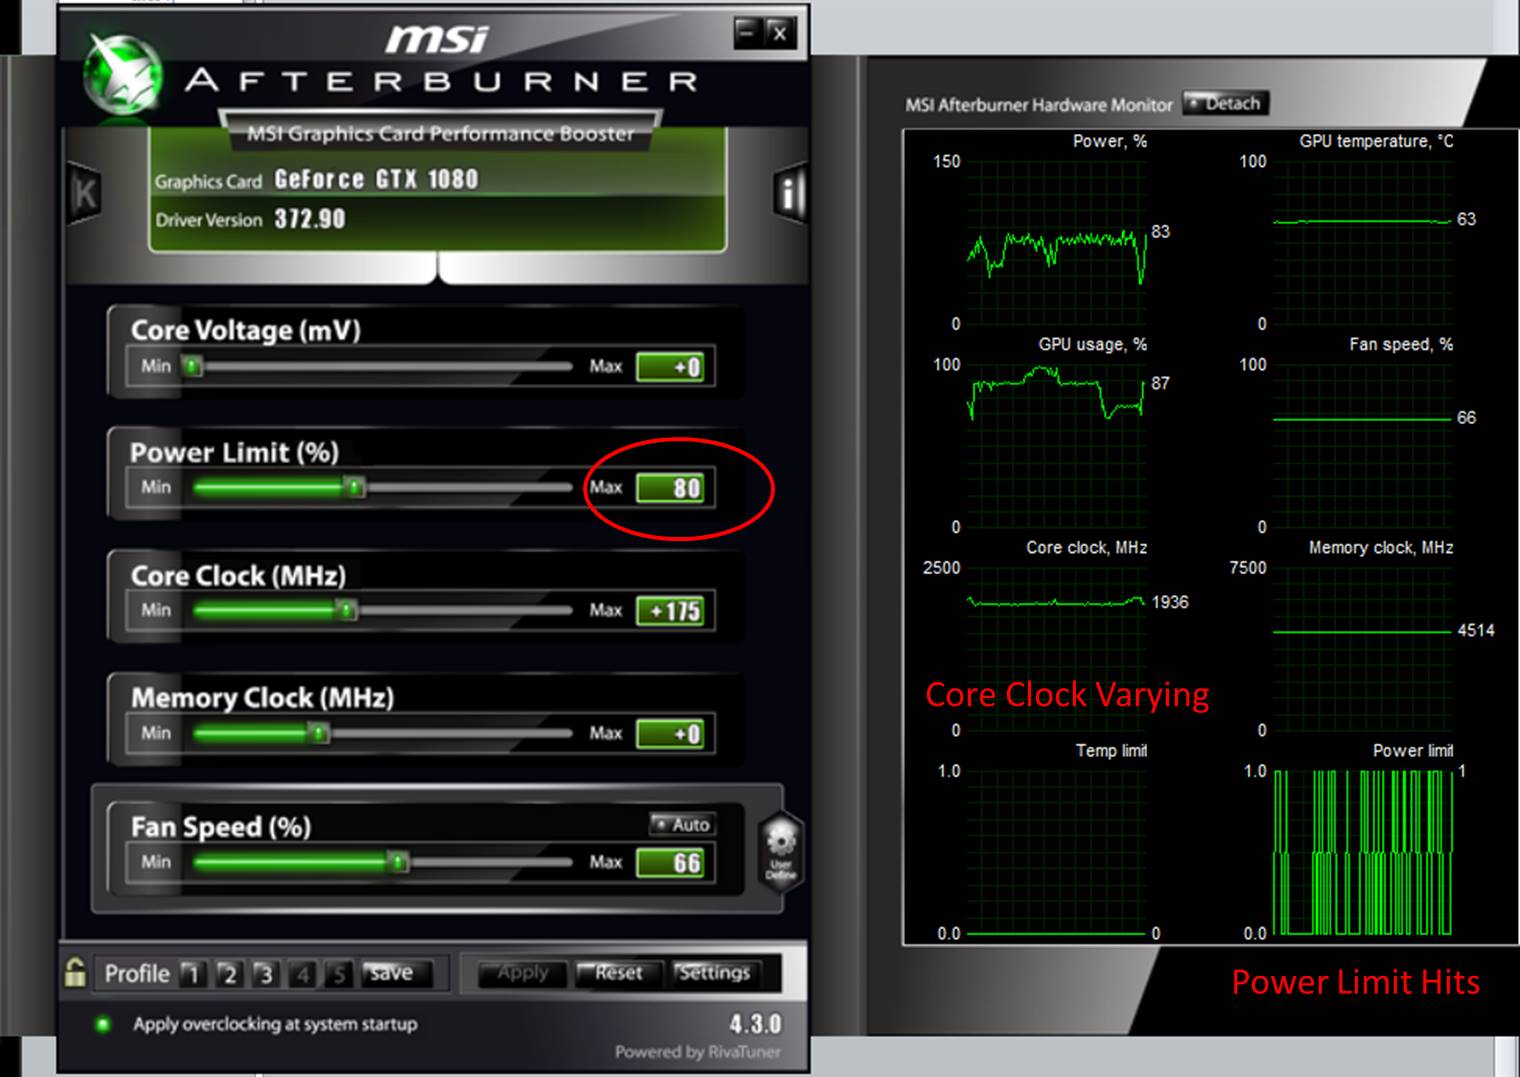
I ran this test with the memory clock rate at the stock clock for the P2 power state (4500 MHz), along with the gaming clock rate of 5000 MHz and a reduced clock rate of 4000 MHz. This gives me three data points of comparison. I left the GPU core clock at +175 MHz (the optimum setting from my first article on the 1080 GTX) and the power limit at 100%, to ensure I had headroom to move the memory clock without affecting the core clock. I verified I wasn’t hitting the power limit in MSI Afterburner.
*Update. Some people may ask why I didn’t go beyond the standard P0 gaming memory clock rate of 5000 MHz (same thing as 10,000 MHz double data rate, which is the card’s advertised memory clock). Basically, I didn’t want to get into the territory where the GDDR5’s error checking comes into play. If you push the memory too hard, there can be errors in the computation but work units can still complete (unlike a GPU core overclock, where work units will fail due to errors). The reason is the built-in error checking on the card memory, which corrects errors as they come up but results in reduced performance. By staying away from 5000+ MHz territory on the memory, I can ensure the relationship between performance and memory clock rate is not affected by memory error correction.

Memory Overclocking Performed in MSI Afterburner
Tabular Results
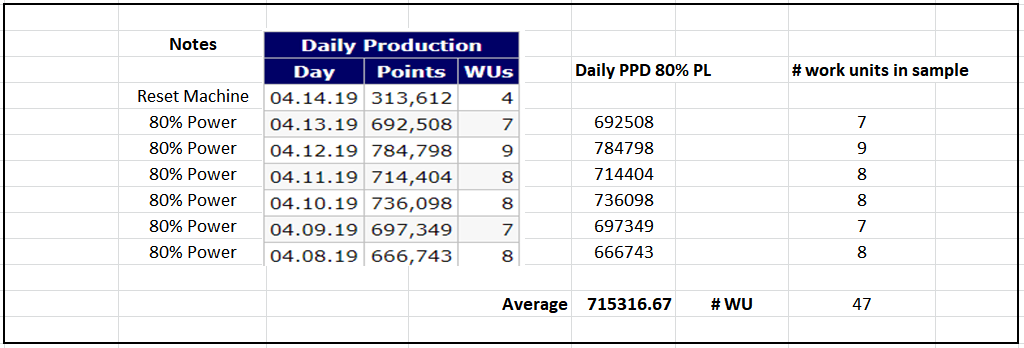
I put together a table of results in order to show how the averaging was done, and the # of work units backing up my +500 MHz and -500 MHz data points. Having a bunch of work units is key, because there is significant variability in PPD and power consumption numbers between work units. Note that the performance and efficiency numbers for the baseline memory speed (+0 MHz, aka 4500 MHz) come from my extended testing baseline for the 1080 and have even more sample points.

Nvidia GTX 1080 Folding@Home Production History: Data shows increased performance with a higher memory speed
Graphic Results
The following graphs show the PPD, Power Consumption, and Efficiency curves as a function of graphics card memory speed. Since I had three points of data, I was able to do a simple three-point-curve linear trendline fit. The R-squared value of the trendline shows how well the data points represent a linear relationship (higher is better, with 1 being ideal). Note that for the power consumption, the card seems to have used more power with a lower memory clock rate than the baseline memory clock. I am not sure why this is…however, the difference is so small that it is likely due to work unit variability or background tasks running on the computer. One could even argue that all of the power consumption results are suspect, since the changes are so small (on the order of 5-10 watts between data points).


Conclusion
Increasing the memory speed of the Nvidia Geforce GTX 1080 results in a modest increase in PPD and efficiency, and arguably a slight increase in power consumption. The difference between the fastest (+500 MHz) and slowest (-500 MHz) data points I tested are:
PPD: +81K PPD (11.5%)
Power: +9.36 Watts (3.8%)
Efficiency: +212.8 PPD/Watt (7.4%)
Keep in mind that these are for a massive difference in ram speed (5000 MHz vs 4000 MHz).
Another way to look at these results is that underclocking the graphics card ram in hopes of improving efficiency doesn’t work (you’ll actually lose efficiency). I expect this trend will hold true for the rest of the Nvidia Pascal series of cards (GTX 10xx), although so far my testing of this has been limited to this one card, so your mileage may vary. Please post any insights if you have them.