Intro
It’s hard to believe that the Nvidia GTX 1080 is almost three years old now, and I’m just getting around to writing a Folding@Home review of it. In the realm of graphics cards, this thing is legendary, and only recently displaced from the enthusiast podium by Nvidia’s new RTX series of cards. The 1080 was Nvidia’s top of the line gaming graphics card (next to the Ti edition of course), and has been very popular for both GPU coin mining and cancer-curing (or at least disease research for Stanford University’s charitable distributed computing project: Folding@Home). If you’ve been following along, you know it’s that second thing that I’m interested in. The point of this review is to see just how well the GTX 1080 folds…and by well, I mean not just raw performance, but also energy efficiency.
Quick Stats Comparison
I threw together a quick table to give you an idea of where the GTX 1080 stacks up (I left the newer RTX cards and the older GTX 9-series cards off of here because I’m lazy…
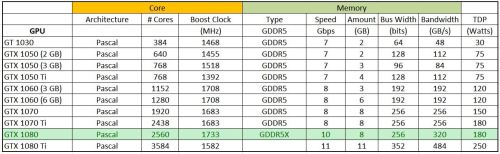
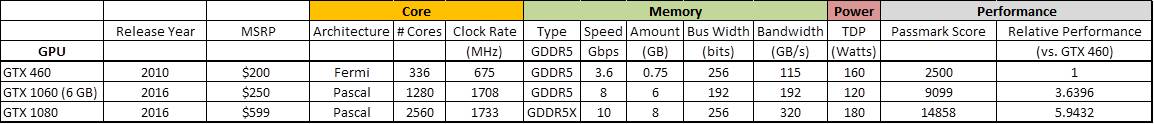
Nvidia Pascal Family GPU Comparison
As you can see, the GTX 1080 is pretty fast, eclipsed only by the GTX 1080 Ti (which also has a higher Thermal Design Power, suggesting more electricity usage). From my previous articles, we’ve seen that the more powerful cards tend to do work more efficiency, especially if they are in the same TDP bracket. So, the 1080 should be a better folder (both in PPD and PPD/Watt efficiency) than the 1070 Ti I tested last time.
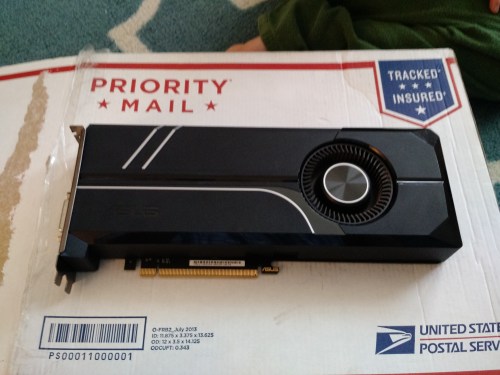
Test Card: ASUS GeForce GTX 1080 Turbo
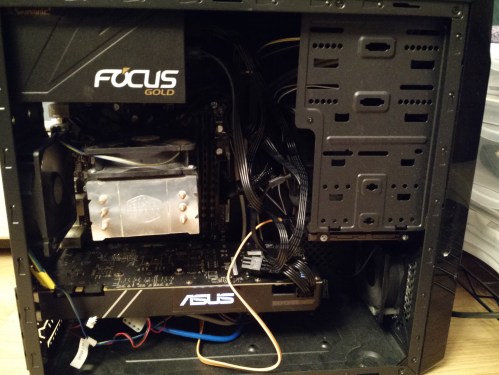
As with the 1070 Ti, I picked up a pretty boring flavor of a 1080 in the form of an Asus turbo card. These cards lack back plates (which help with circuit board rigidity and heat dissipation) and use cheap blower coolers, which suck in air from a single centrifugal fan on the underside and blow it out the back of the case (keeping the hot air from building up in the case). These are loud, and tend to run hotter than open-fan coolers, so overclocking and boost clocks are limited compared to aftermarket designs. However, like Nvidia’s own Founder’s Edition reference cards, this reference design provides a good baseline for a 1080’s minimum performance.
ASUS GeForce GTX 1080 Turbo
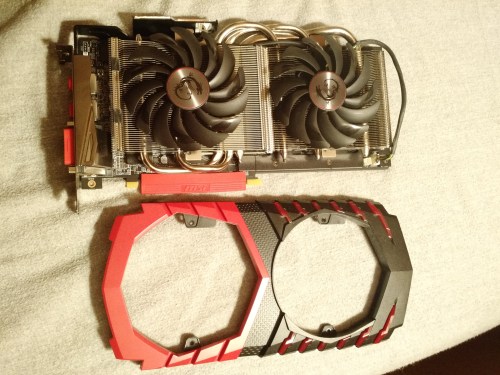
The new 1080 looks strikingly similar to the 1070 Ti…Asus is obviously reusing the exact same cooler since both cards have a 180 Watt TDP.
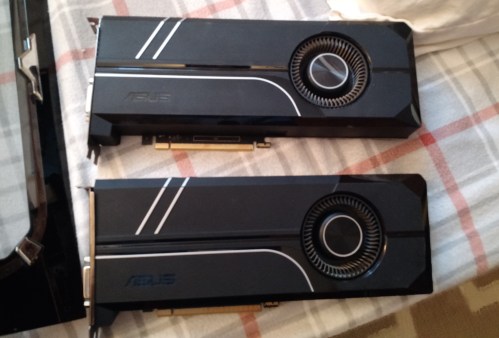
Asus GTX 1080 and 1070 Ti (which one is which?)
Test Environment
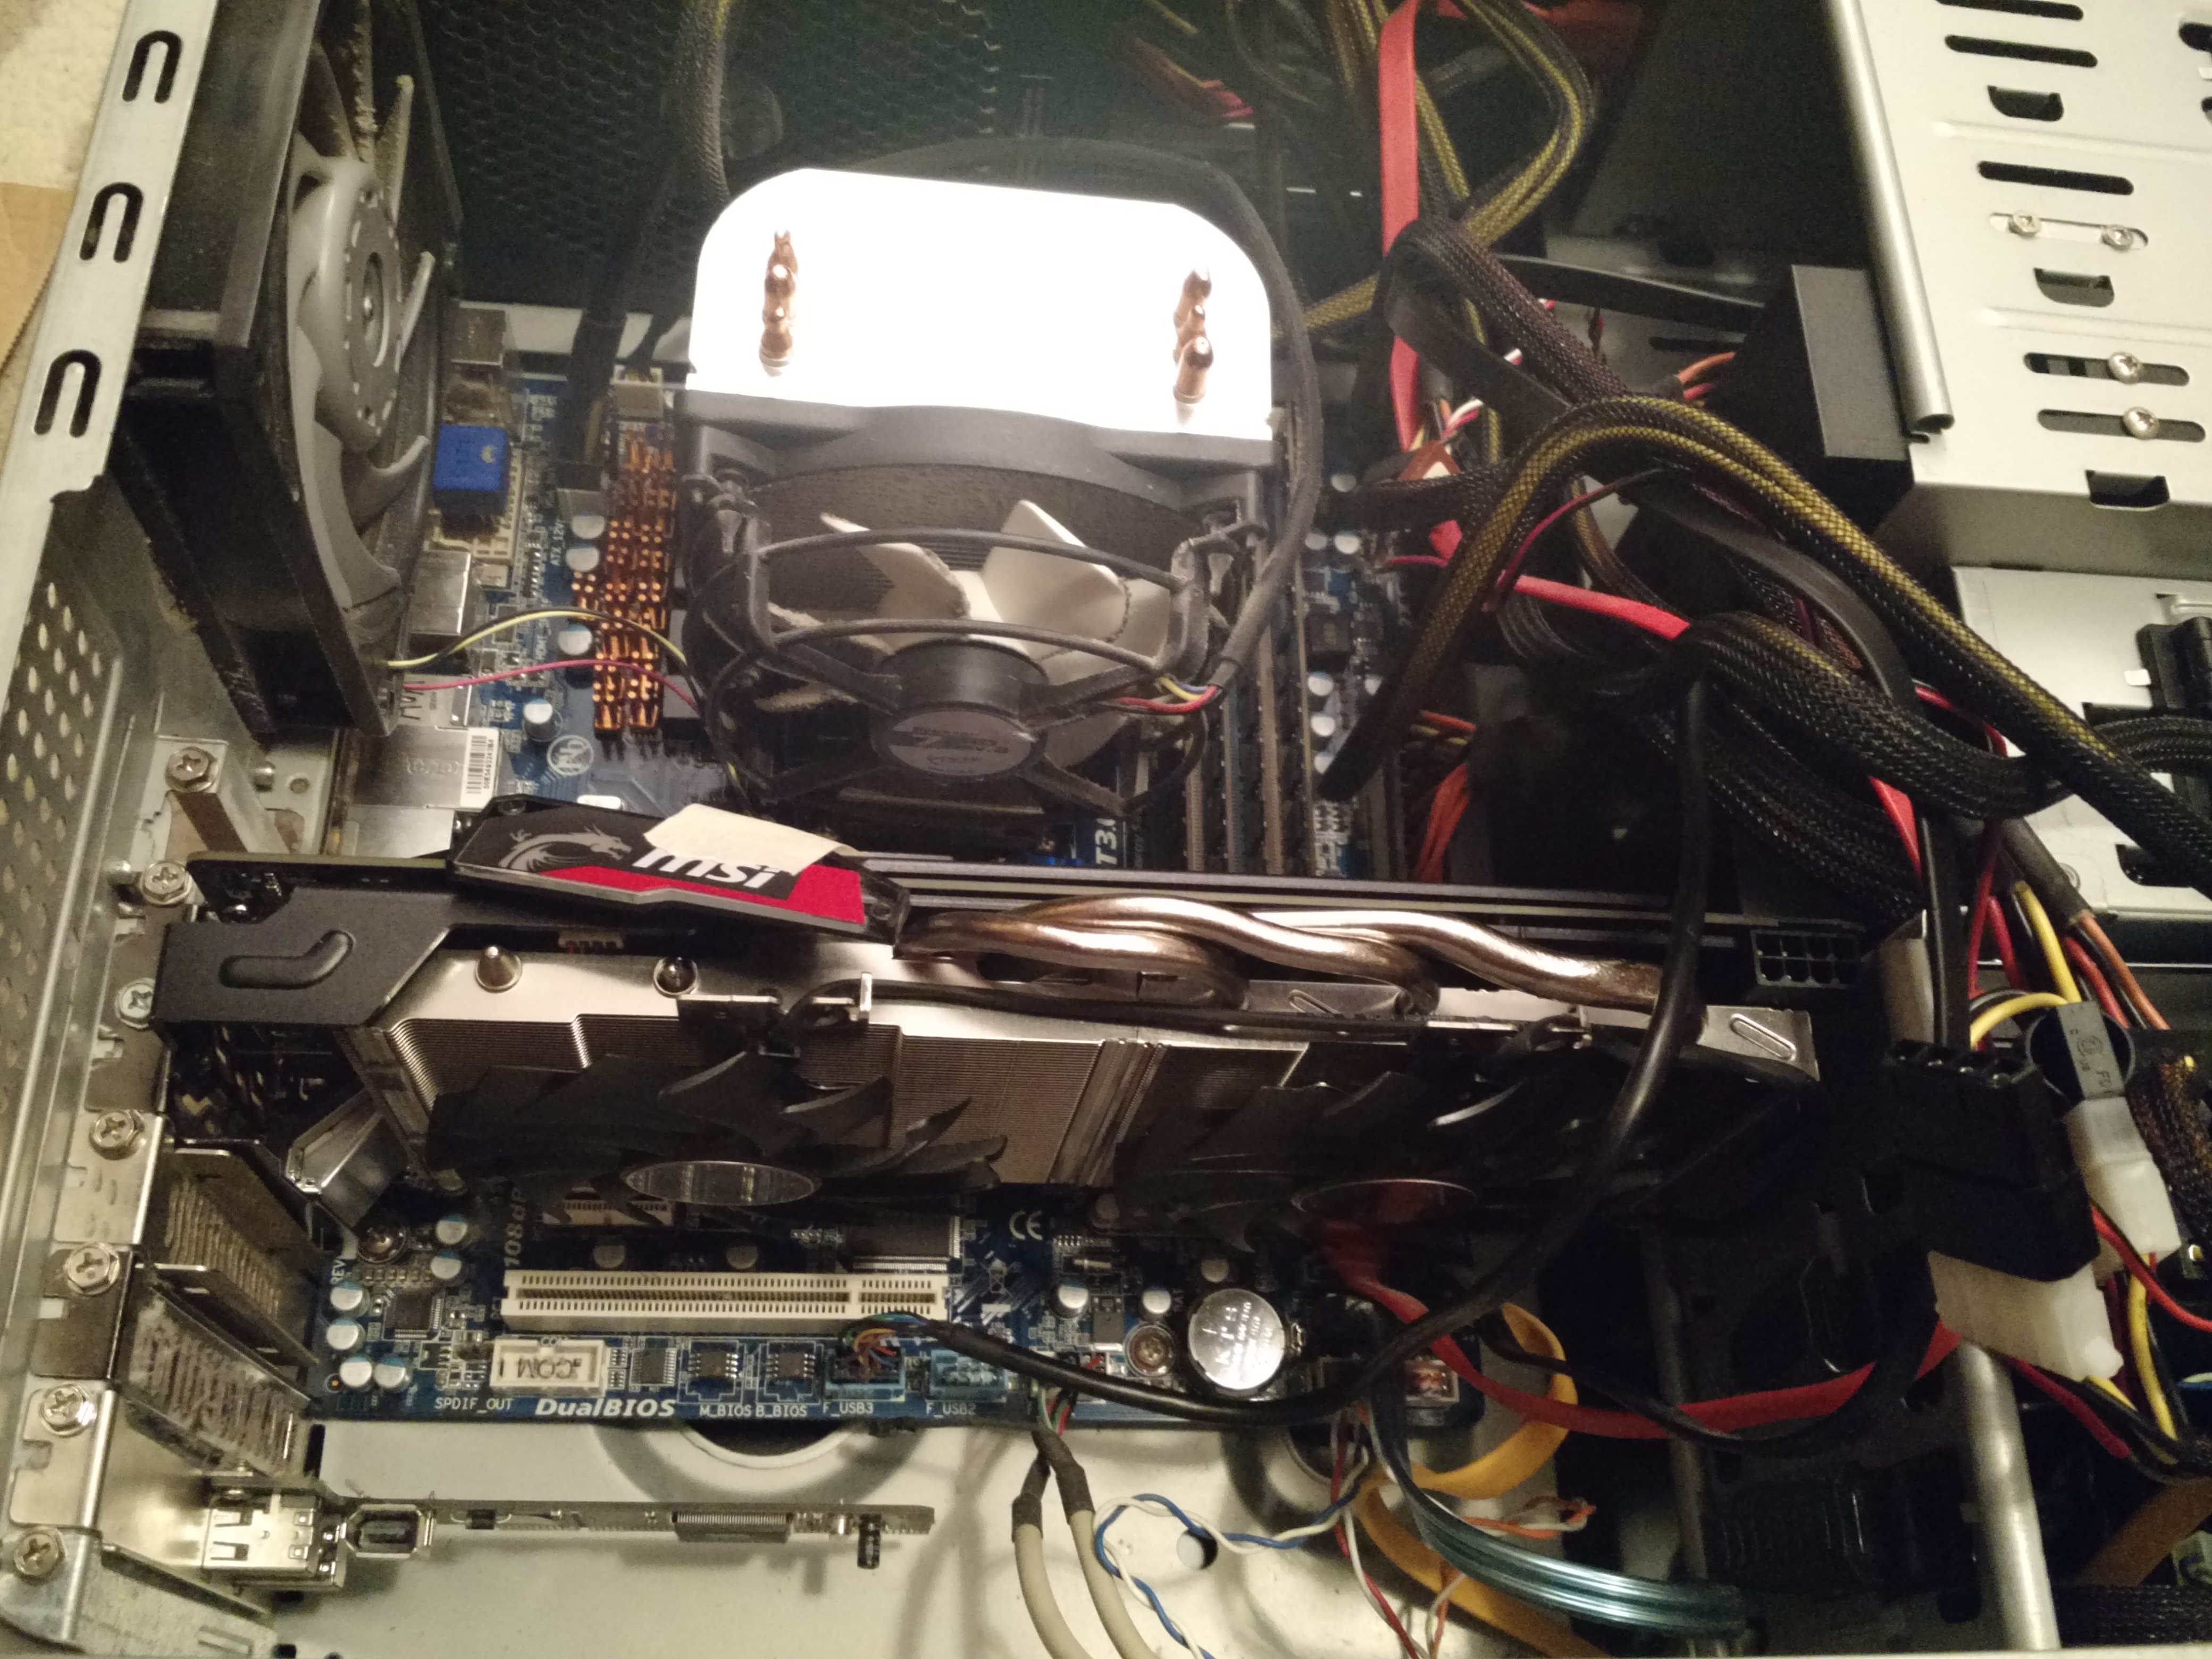
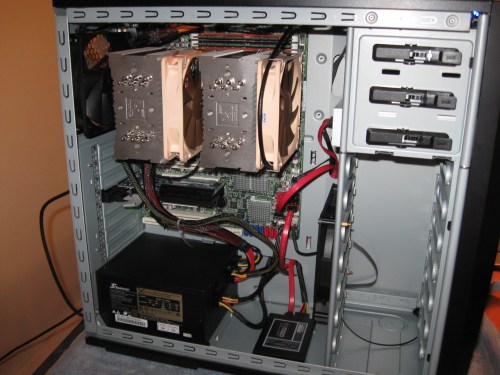
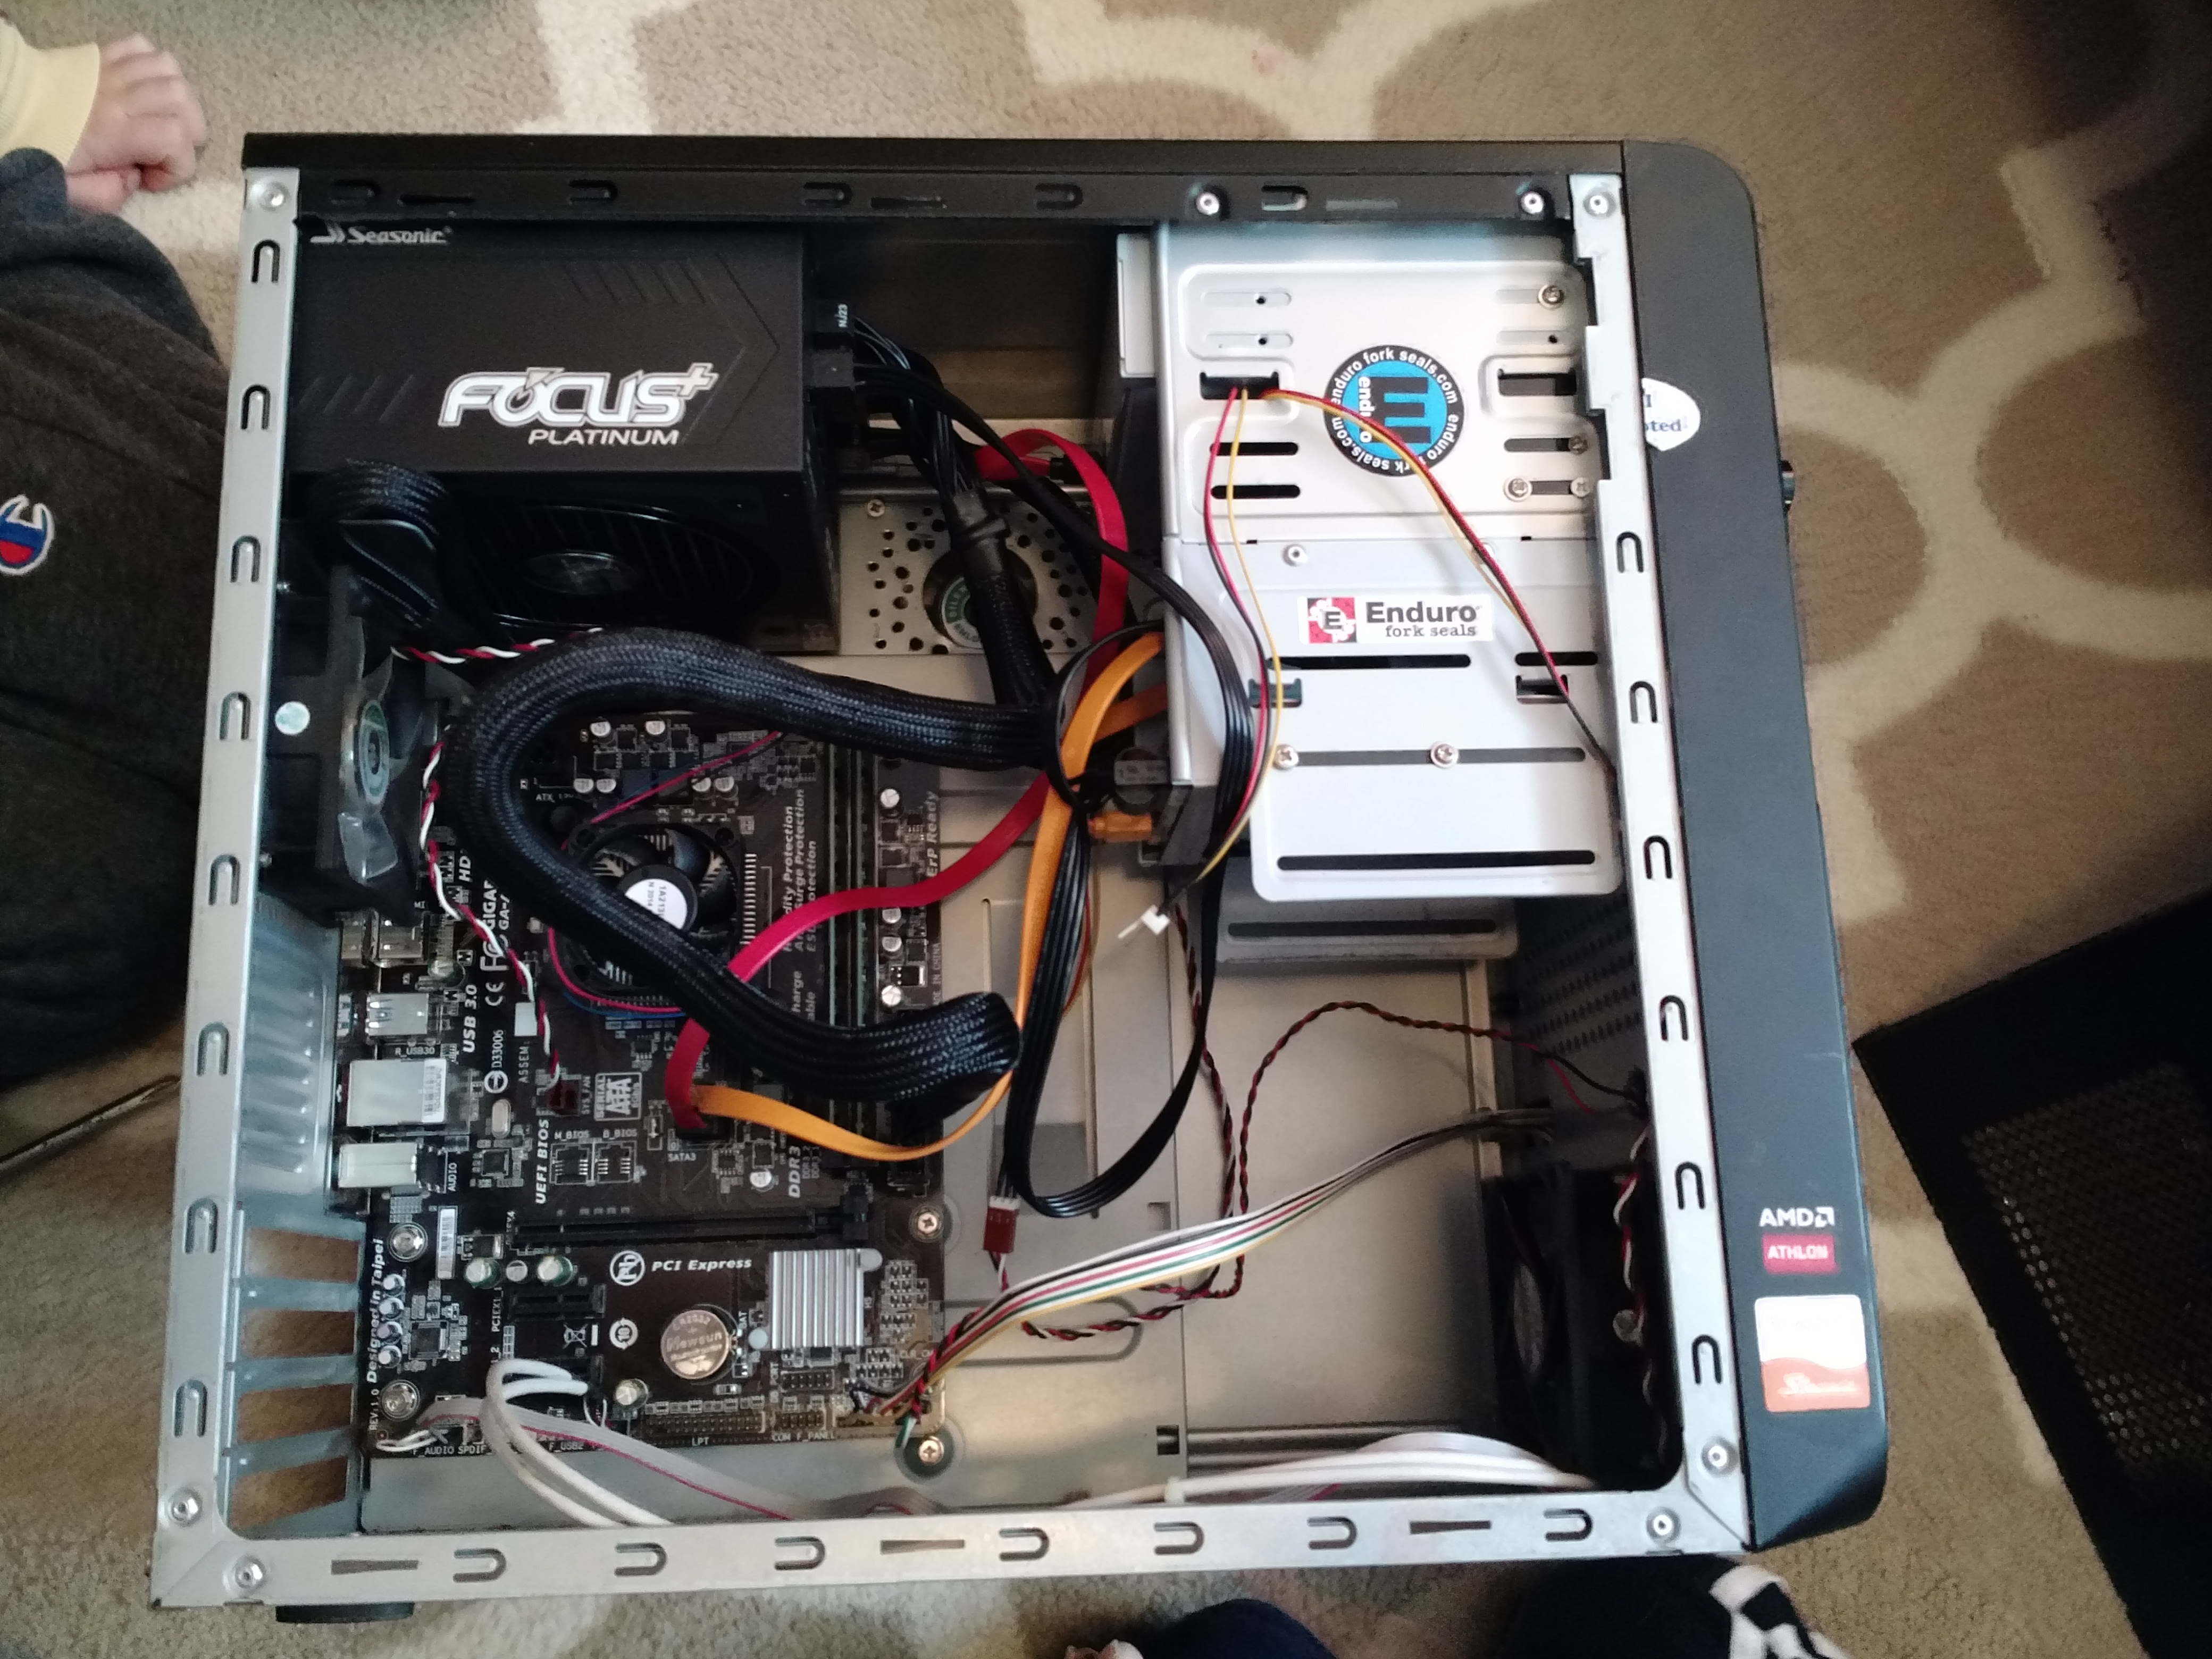
Like most of my previous graphics card testing, I put this into my AMD FX-Based Test System. If you are interested in how this test machine does with CPU folding, you can read about it here. Testing was done using Stanford’s Folding@Home V7 Client (version 7.5.1) in Windows 10. Points Per Day (PPD) production was collected from Stanford’s servers. Power measurements were done with a P3 Kill A Watt Meter (taken at the wall, for a total-system power profile).
Test Setup Specs
- Case: Raidmax Sagitta
- CPU: AMD FX-8320e
- Mainboard : Gigabyte GA-880GMA-USB3
- GPU: Asus GeForce 1080 Turbo
- Ram: 16 GB DDR3L (low voltage)
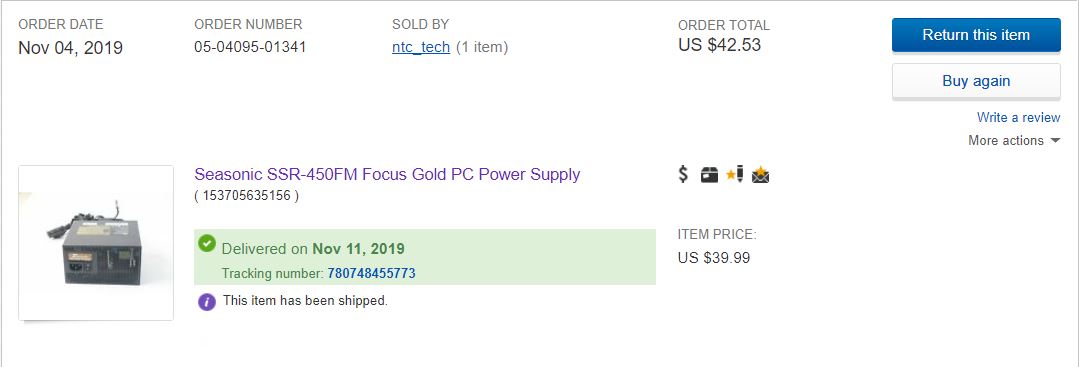
- Power Supply: Seasonic X-650 80+ Gold
- Drives: 1x SSD, 2 x 7200 RPM HDDs, Blu-Ray Burner
- Fans: 1x CPU, 2 x 120 mm intake, 1 x 120 mm exhaust, 1 x 80 mm exhaust
- OS: Win10 64 bit
- Video Card Driver Version: 372.90
Video Card Configuration – Optimize for Performance
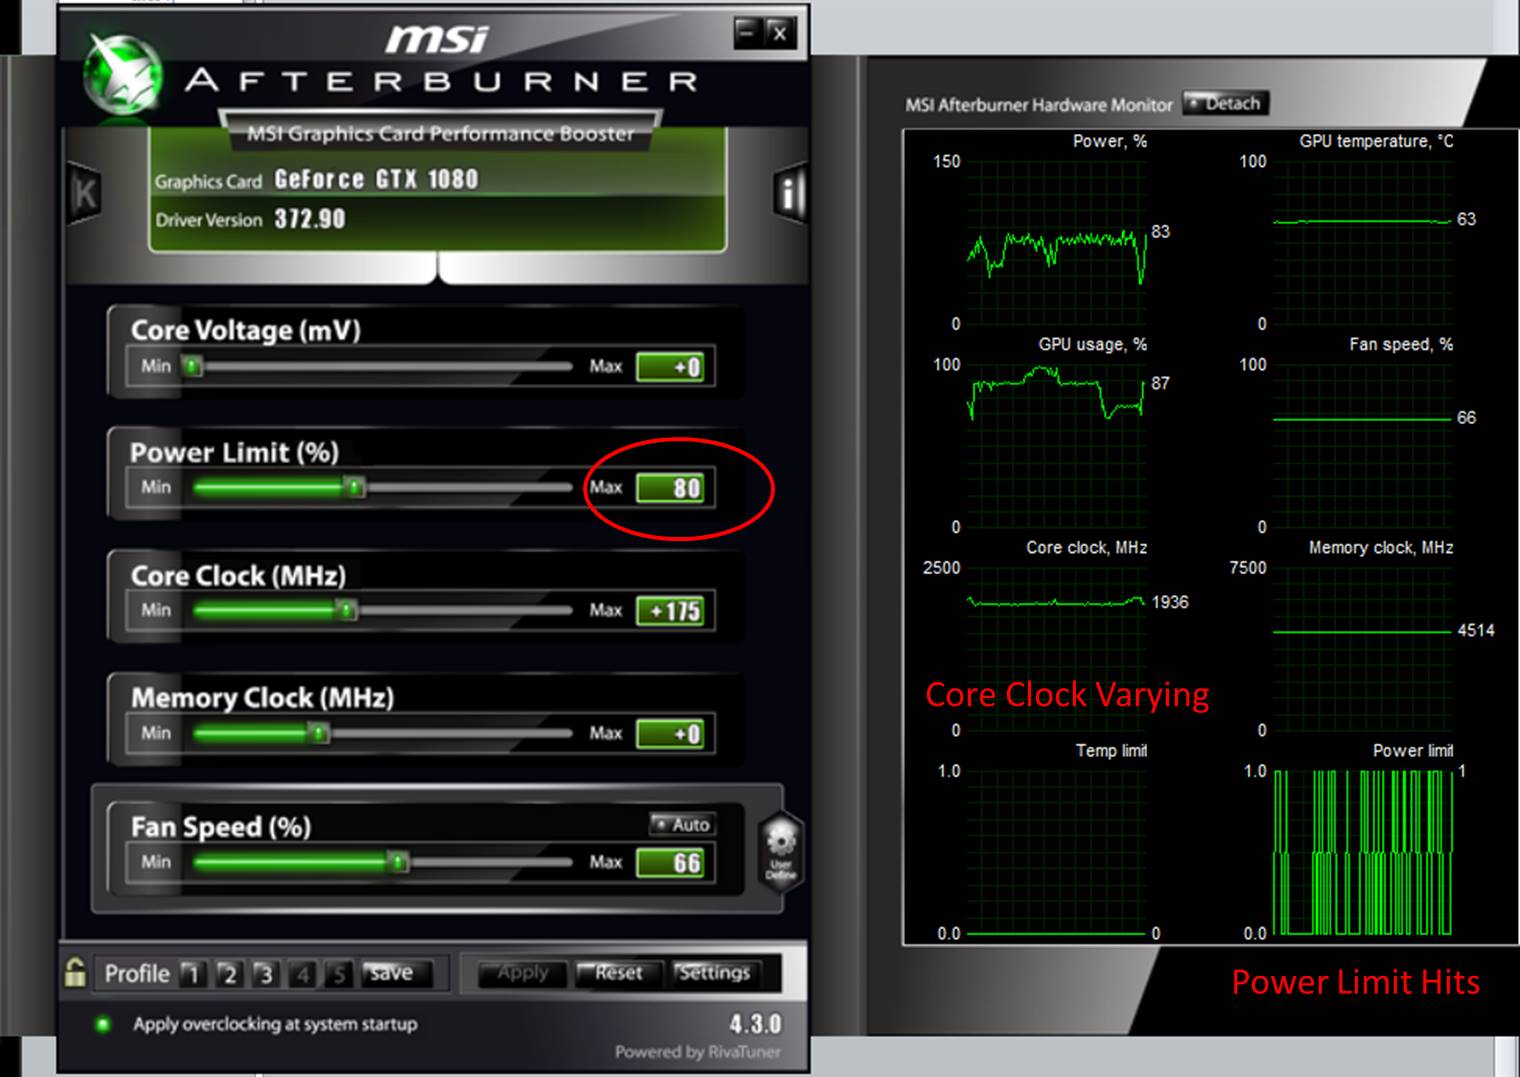
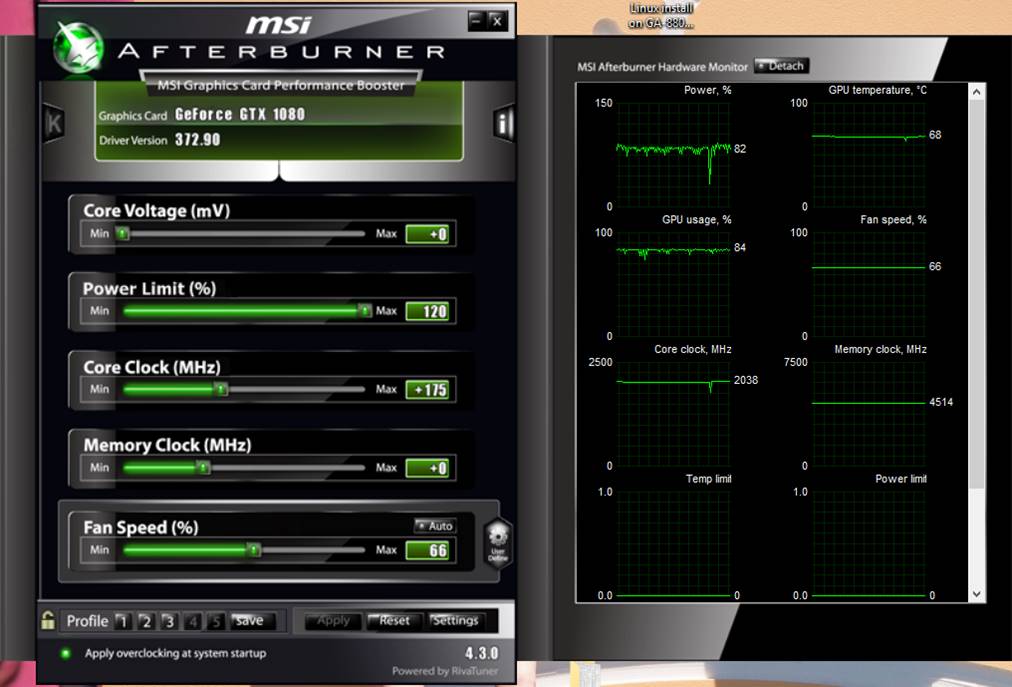
In my previous articles, I’ve shown how Nvidia GPUs don’t always automatically boost their clock rates when running Folding@home (as opposed to video games or benchmarks). The same is true of the GTX 1080. It sometimes needs a little encouragement in order to fold at the maximum performance. I overclocked the core by 175 MHz and increased the power limit* by 20% in MSI afterburner using similar settings to the GTX 1070. These values were shown to be stable after 2+ weeks of testing with no dropped work units.
*I also experimented with the power limit at 100% and I saw no change in card power consumption. This makes sense…folding is not using 100% of the GPU. Inspection of the MSI afterburner plots shows that while folding, the card does not hit the power limit at either 100% or 120%. I will have to reduce the power limit to get the card to throttle back (this will happen in part 2 of this article).
As with previous cards, I did not push the memory into its performance zone, but left it at the default P2 (low-power) state clock rate. The general consensus is that memory clock does not significantly affect folding@home, and it is better to leave the power headroom for the core clock, which does improve performance. As an interesting side-note, the memory clock on this thing jumps up to 5000 Mhz (effective) in benchmarks. For example, see the card’s auto-boost settings when running Heaven:

Nvidia GeForce GTX 1080 – Boost Clocks (auto) in Heaven Benchmark
Testing Overview
For most of my tests, I just let the computer run folding@home 24/7 for a couple of days and then average the points per day (PPD) results from Stanford’s stats server. Since the GTX 1080 is such a popular card, I decided to let it run a little longer (a few weeks) to get a really good sampling of results, since PPD can vary a lot from work unit to work unit. Before we get into the duration results, let’s do a quick overview of what the Folding@home environment looks like for a typical work unit.
The following is an example screen shot of the display from the client, showing an instantaneous PPD of about 770K, which is very impressive. Here, it is folding on a core 21 work unit (Project 14124).
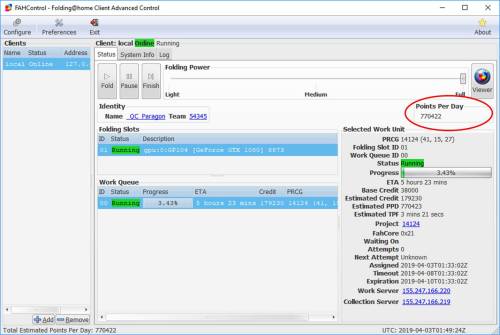
Folding@Home V7 Client – GeForce GTX 1080
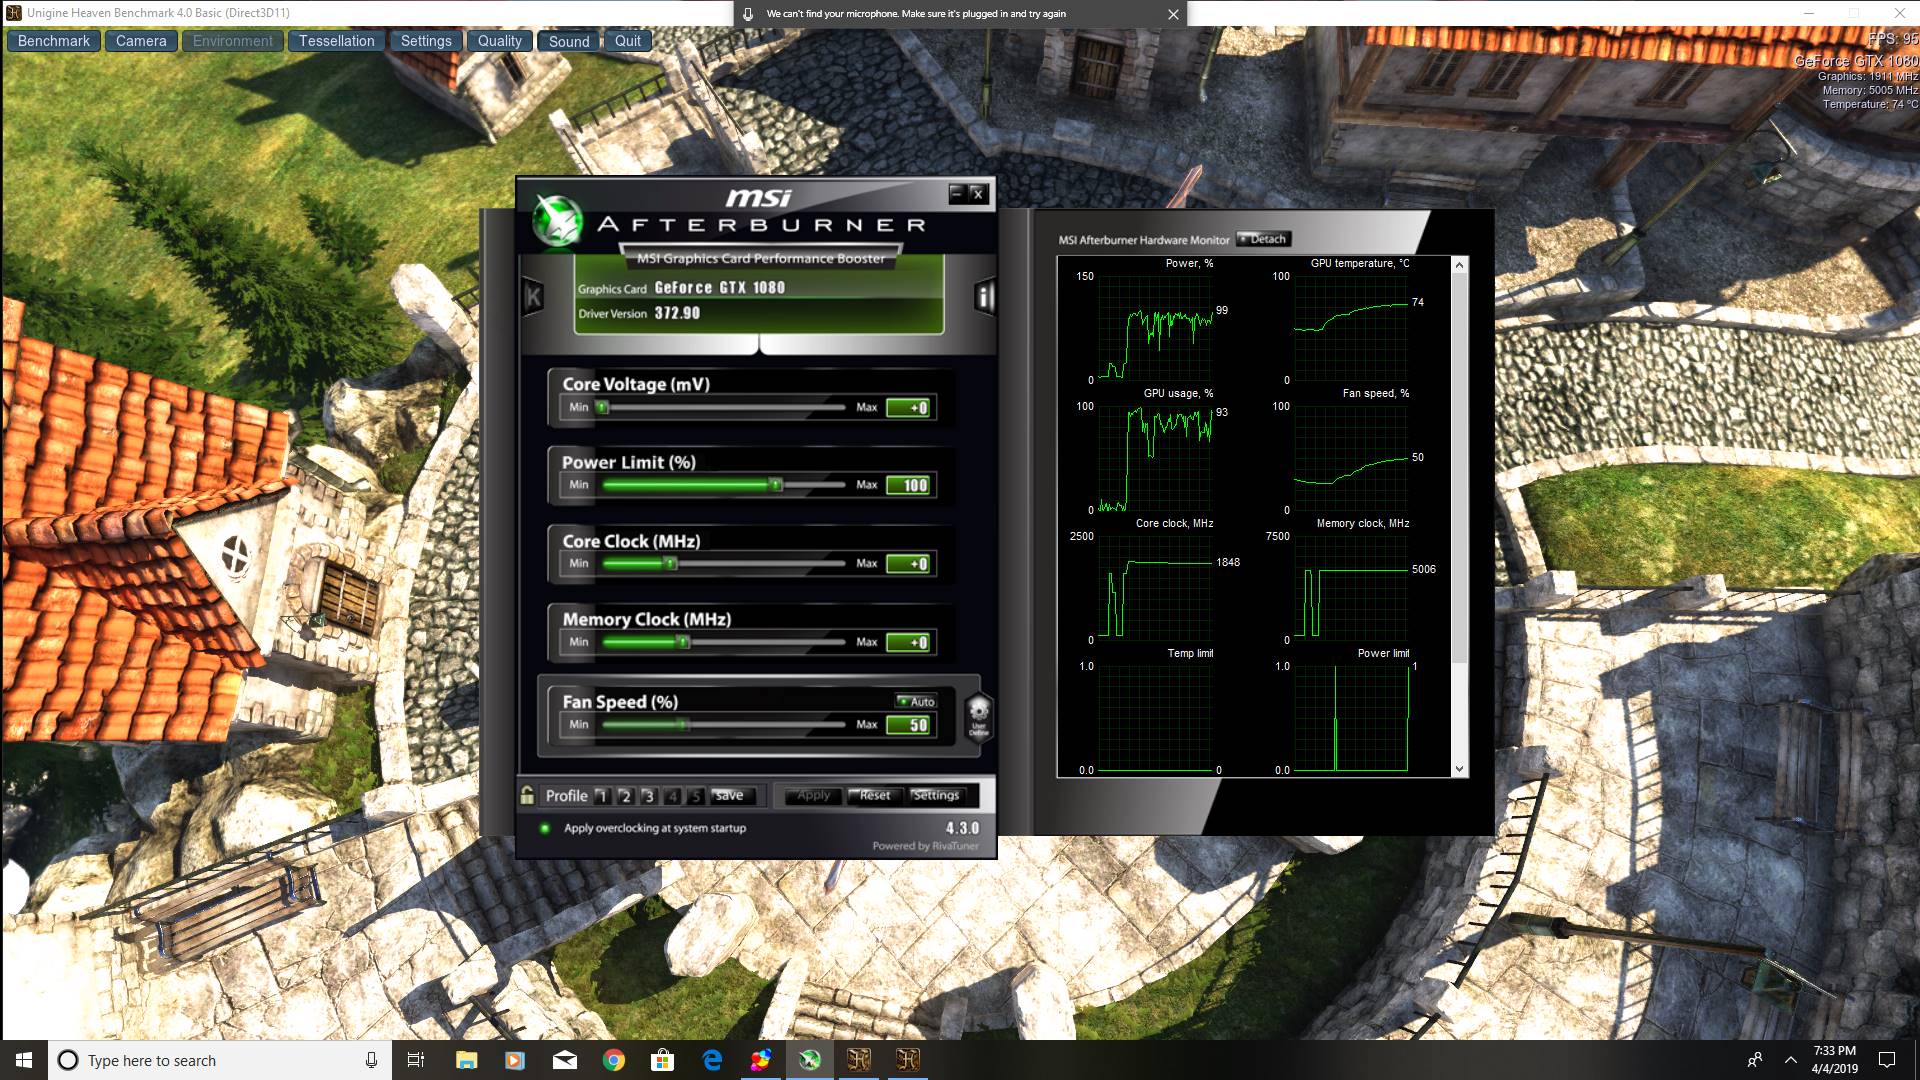
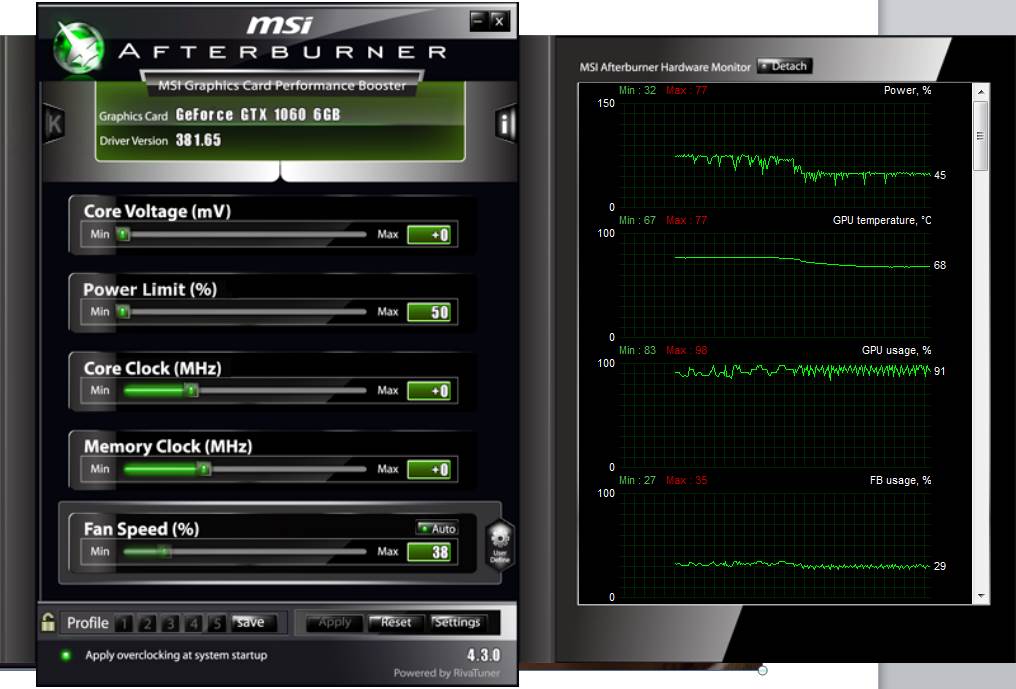
MSI Afterburner is a handy way to monitor GPU stats. As you can see, the GPU usage is hovering in the low 80% region (this is typical for GPU folding in Windows. Linux can use a bit more of the GPU for a few percentage points more PPD). This Asus card, with its reference blower cooler, is running a bit warm (just shy of 70 degrees C), but that’s well within spec. I had the power limit at 120%, but the card is nowhere near hitting that…the power limit seems to just peak above 80% here and there.
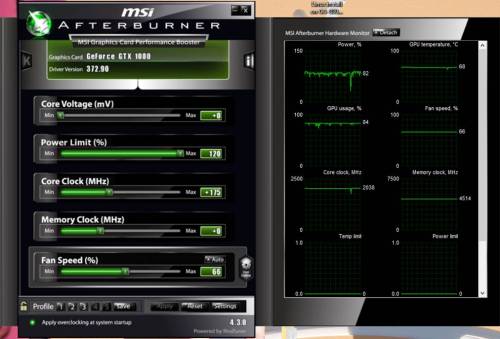
GTX 1080 stats while folding.
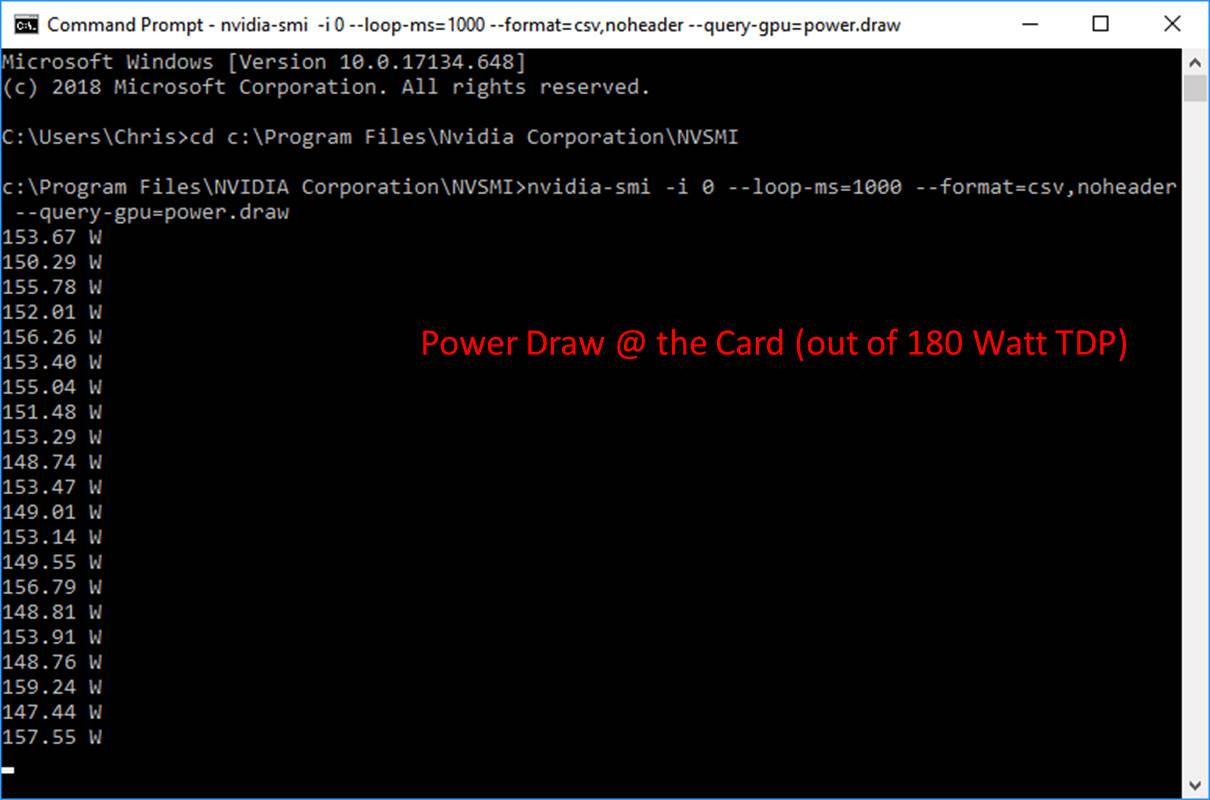
Measuring card power consumption with the driver shows that it’s using about 150 watts, which seems about right when compared to the GPU usage and power % graphs. 100% GPU usage would be ideal (and would result in a power consumption of about 180 watts, which is the 1080’s TDP).
In terms of card-level efficiency, this is 770,000 PPD / 150 Watts = 5133 PPD/Watt.
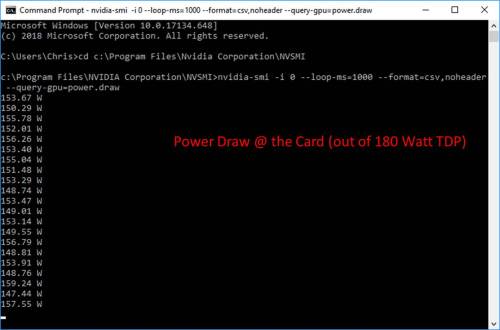
Nvidia Geforce GTX 1080 – Instantaneous Power Draw @ the Card
Duration Testing
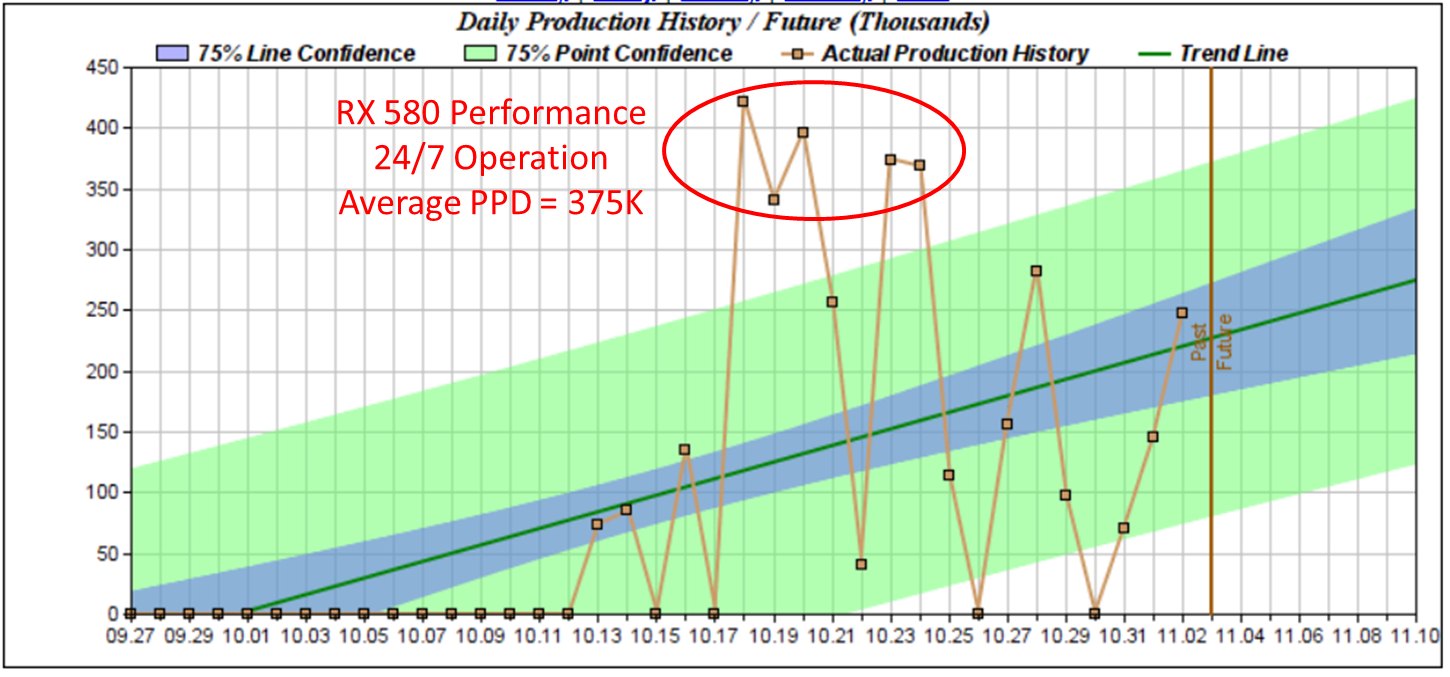
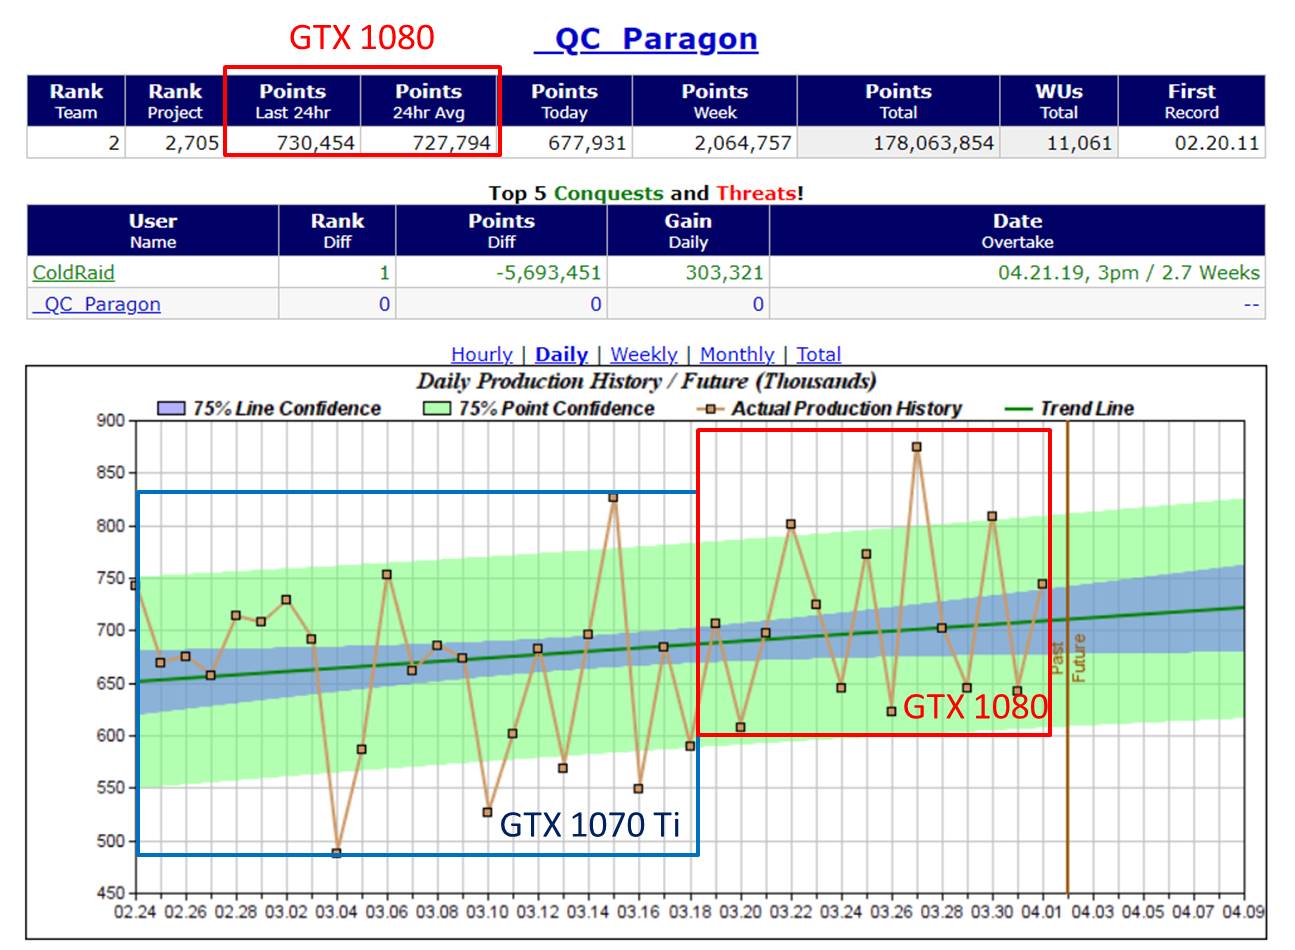
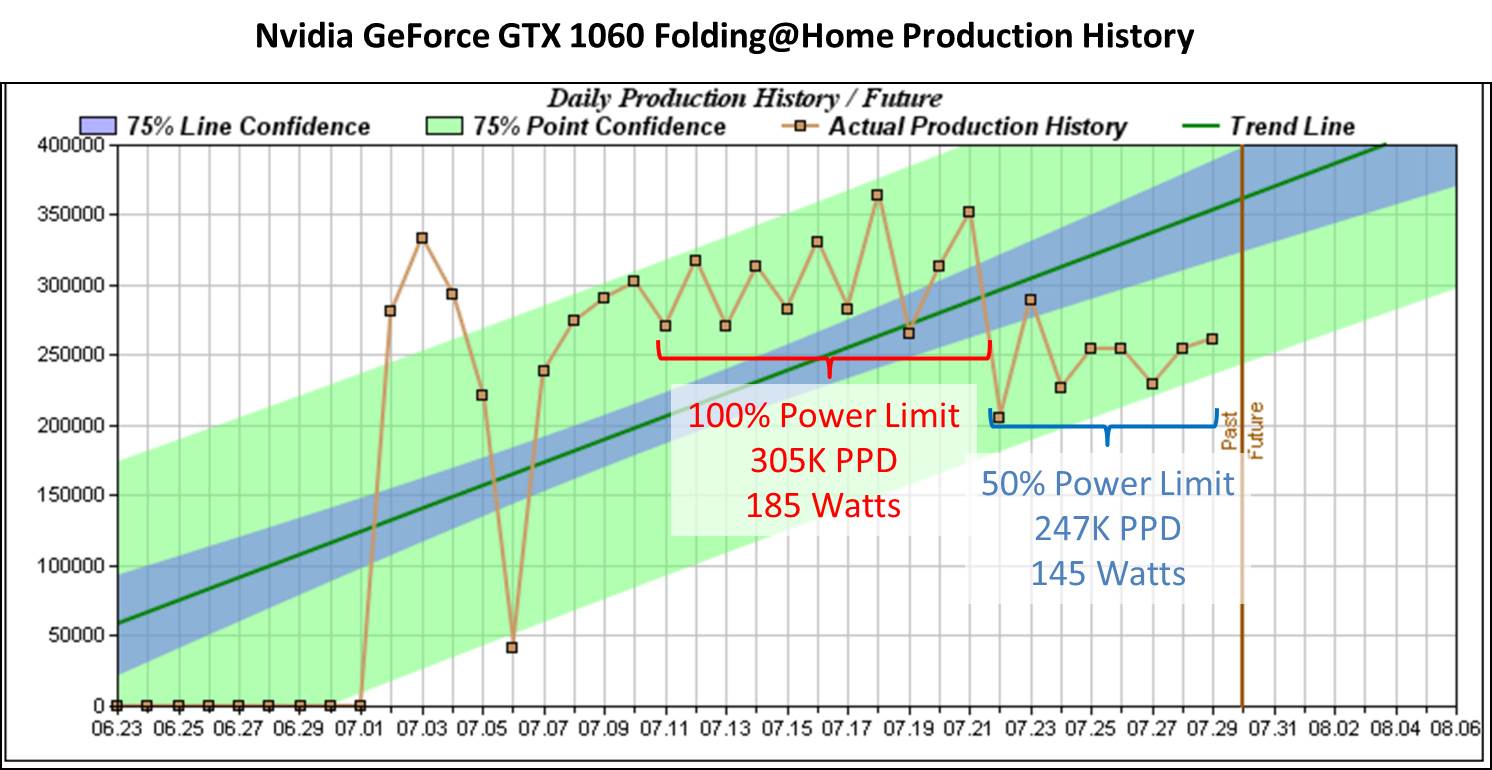
I ran Folding@Home for quite a while on the 1080. As you can see from this plot (courtesy of https://folding.extremeoverclocking.com/), the 1080 is mildly beating the 1070 Ti. It should be noted that the stats for the 1070 Ti are a bit low in the left-hand side of the plot, because folding was interrupted a few times for various reasons (gaming). The 1080 results were uninterrupted.
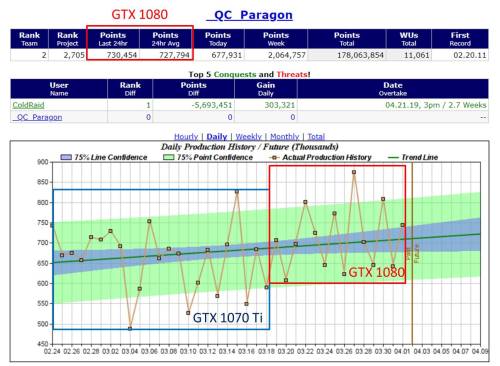
Geforce GTX 1080 Production History
Another thing I noticed was the amount of variation in the results. Normal work unit variation (at least for less powerful cards) is around 10-20 percent. For the GTX 1080, I saw swings of 200K PPD, which is closer to 30%. Check out that one point at 875K PPD!
Average PPD: 730K PPD
I averaged the PPD over two weeks on the GTX 1080 and got 730K PPD. Previous testing on the GTX 1070 Ti (based on continual testing without interruptions) showed an average PPD of 700K. Here is the plot from that article, reproduced for convenience.
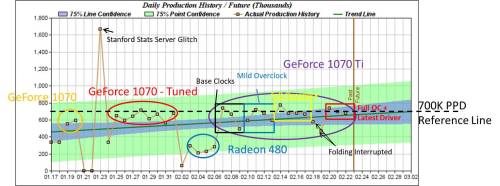
Nvidia GTX 1070 Ti Folding@Home Production Time History
I had expected my GTX 1080 to do a bit better than that. However, it only has about 5% more CUDA cores than the GTX 1070 Ti (2560 vs 2438). The GTX 1080’s faster memory also isn’t an advantage in Folding@Home. So, a 30K PPD improvement for the 1080, which corresponds to about a 4.3% faster, makes sense.
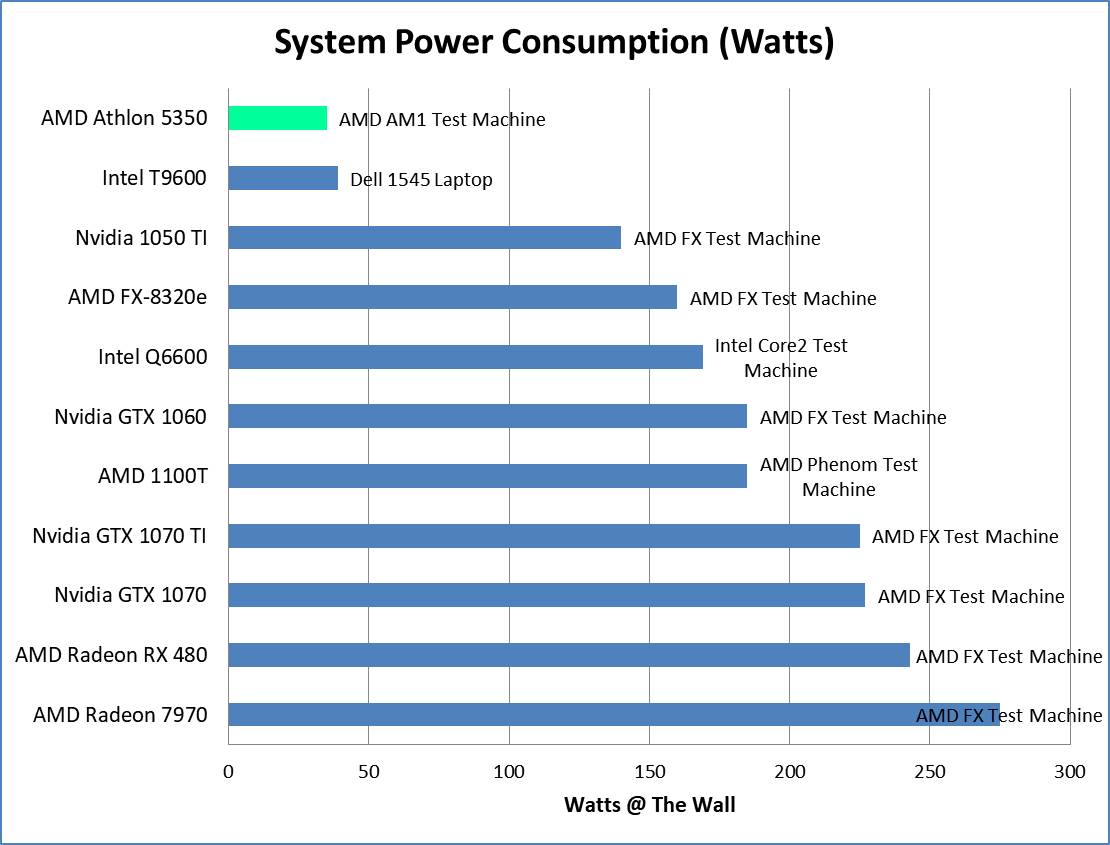
System Average Power Consumption: 240 Watts @ the Wall
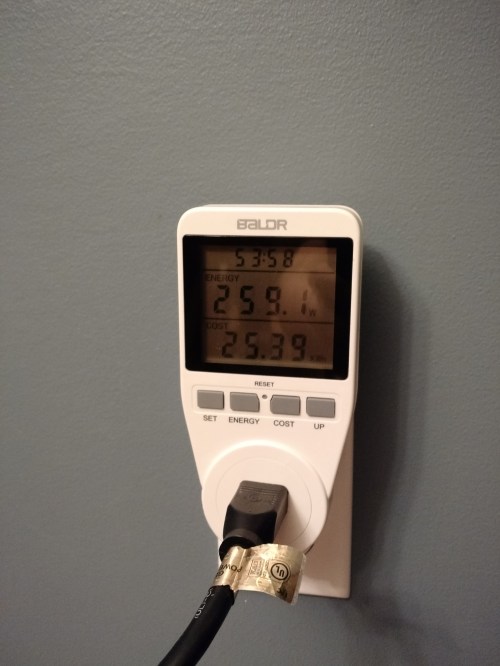
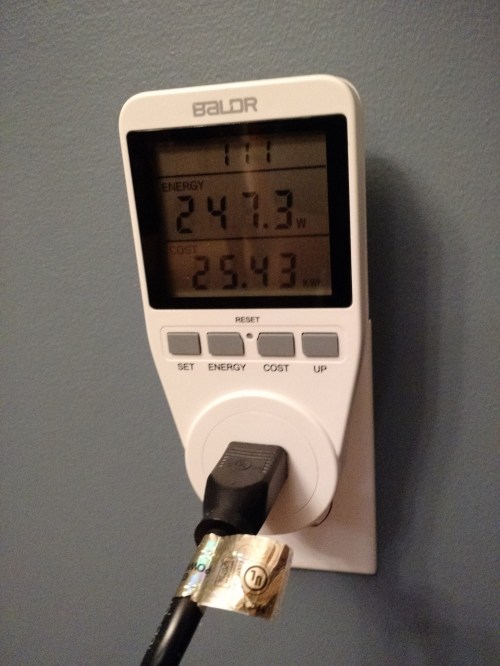
I spot checked the power meter (P3 Kill A Watt) many times over the course of folding. Although it varies with work unit, it seemed to most commonly use around 230 watts. Peek observed wattage was 257, and minimum was around 220. This was more variation than I typically see, but I think it corresponds with the variation in PPD I saw in the performance graph. It was very tempting to just say that 230 watts was the number, but I wasn’t confident that this was accurate. There was just too much variation.
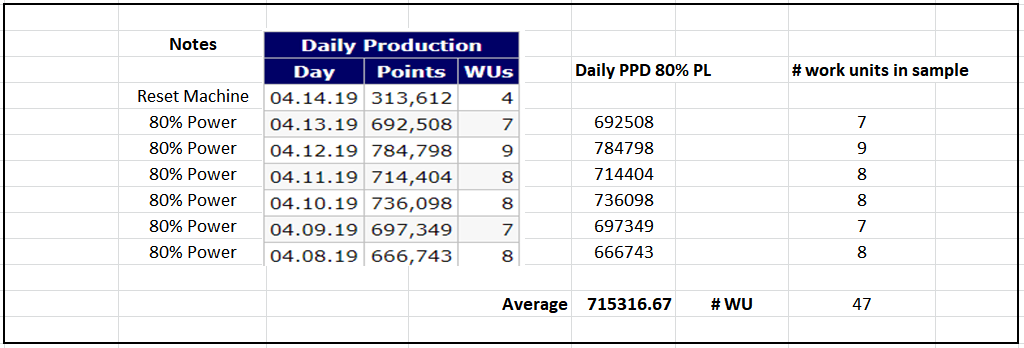
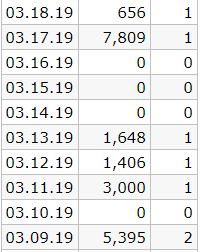
In order to get a better number, I reset the Kill-A-Watt meter (I hadn’t reset it in ages) and let it log the computer’s usage over the weekend. The meter keeps track of the total kilowatt-hours (KWH) of energy consumed, as well as the time period (in hours) of the reading. By dividing the energy by time, we get power. Instead of an instantaneous power (the eyeball method), this is an average power over the weekend, and is thus a compatible number with the average PPD.
The end result of this was 17.39 KWH consumed over 72.5 hours. Thus, the average power consumption of the computer is:
17.39/72.5 (KWH/H) * 1000 (Watts/KW) = about 240 Watts (I round a bit for convenience in reporting, but the Excel sheet that backs up all my plots is exact)
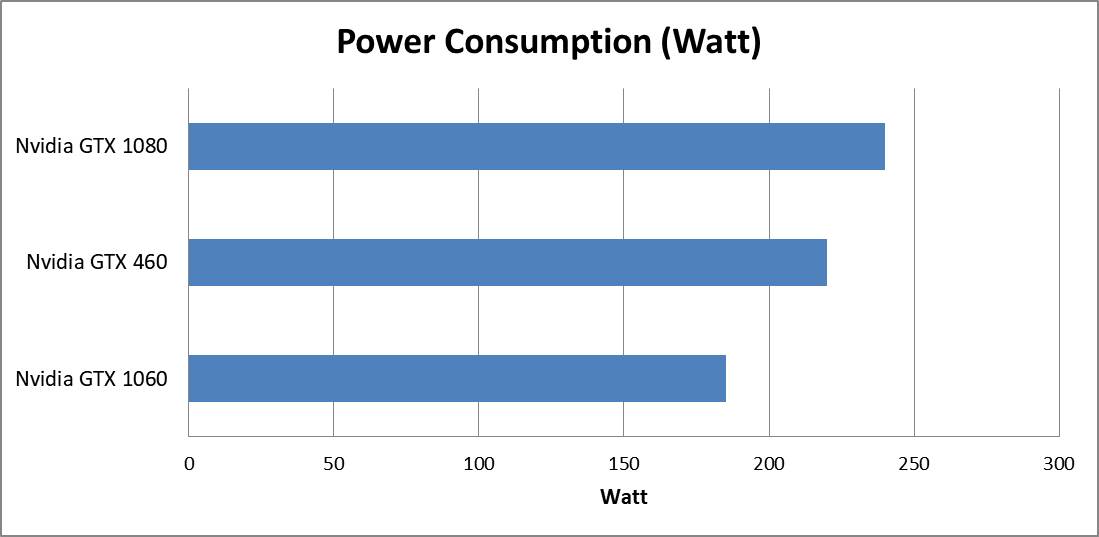
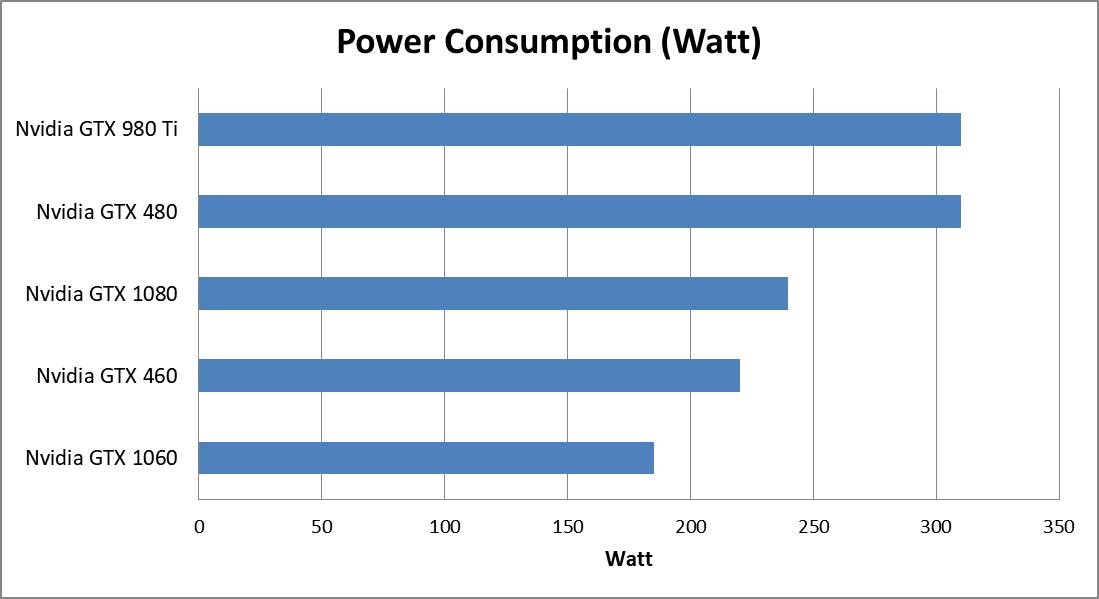
This is a bit more power consumed than the GTX 1070 Ti results, which used an average of 225 watts (admittedly computed by the eyeball method over many days, but there was much less variation so I think it is valid). This increased power consumption of the GTX 1080 vs. the 1070 Ti is also consistent with what people have seen in games. This Legit Reviews article shows an EVGA 1080 using about 30 watts more power than an EVGA 1070 Ti during gaming benchmarks. The power consumption figure is reproduced below:
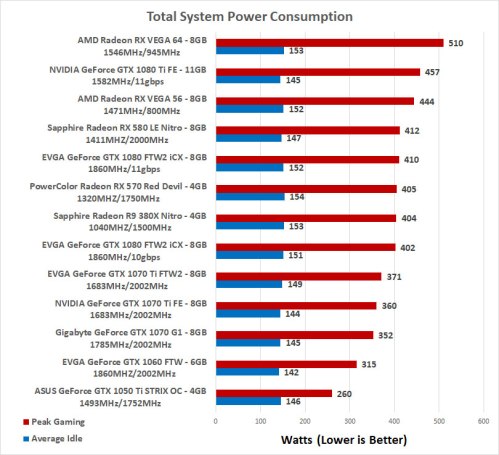
Modern Graphics Card Power Consumption. Source: Legit Reviews
This is a very interesting result. Even though the 1080 and the 1070 Ti have the same 180 Watt TDP, the 1080 draws more power, both in folding@home and in gaming.
System Computational Efficiency: 3044 PPD/Watt
For my Asus GeForce GTX 1080, the folding@home efficiency is:
730,000 PPD / 240 Watts = 3044 PPD/Watt.
This is an excellent score. Surprisingly, it is slightly less than my Asus 1070 Ti, which I found to have an efficiency of 3126 PPD/Watt. In practice these are so close that it just could be attributed to work unit variation. The GeForce 1080 and 1070 Ti are both extremely efficient cards, and are good choices for folding@home.
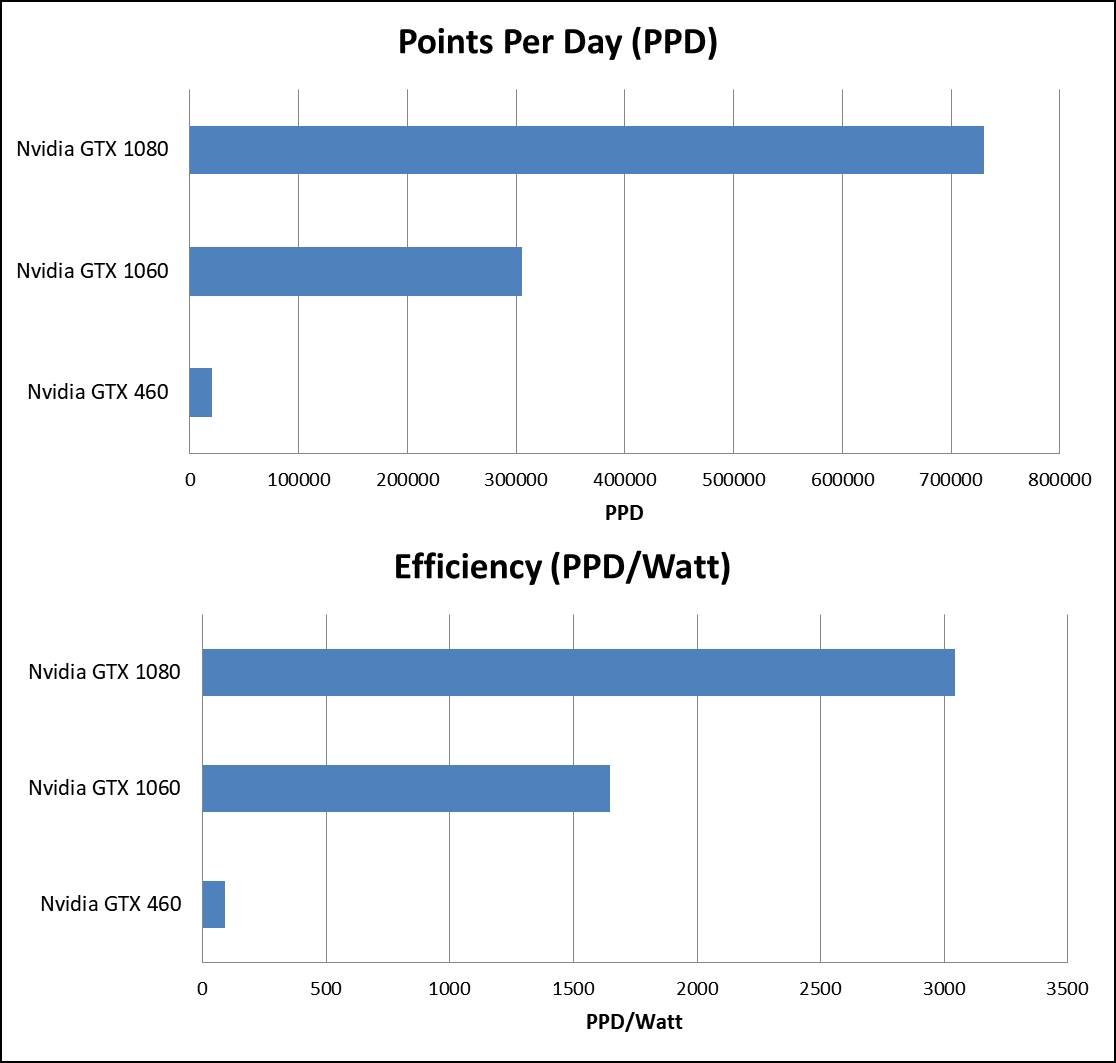
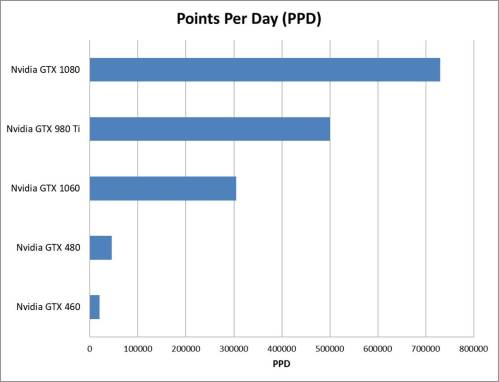
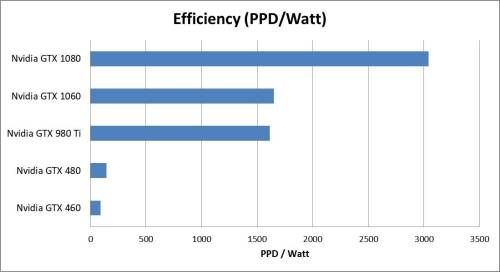
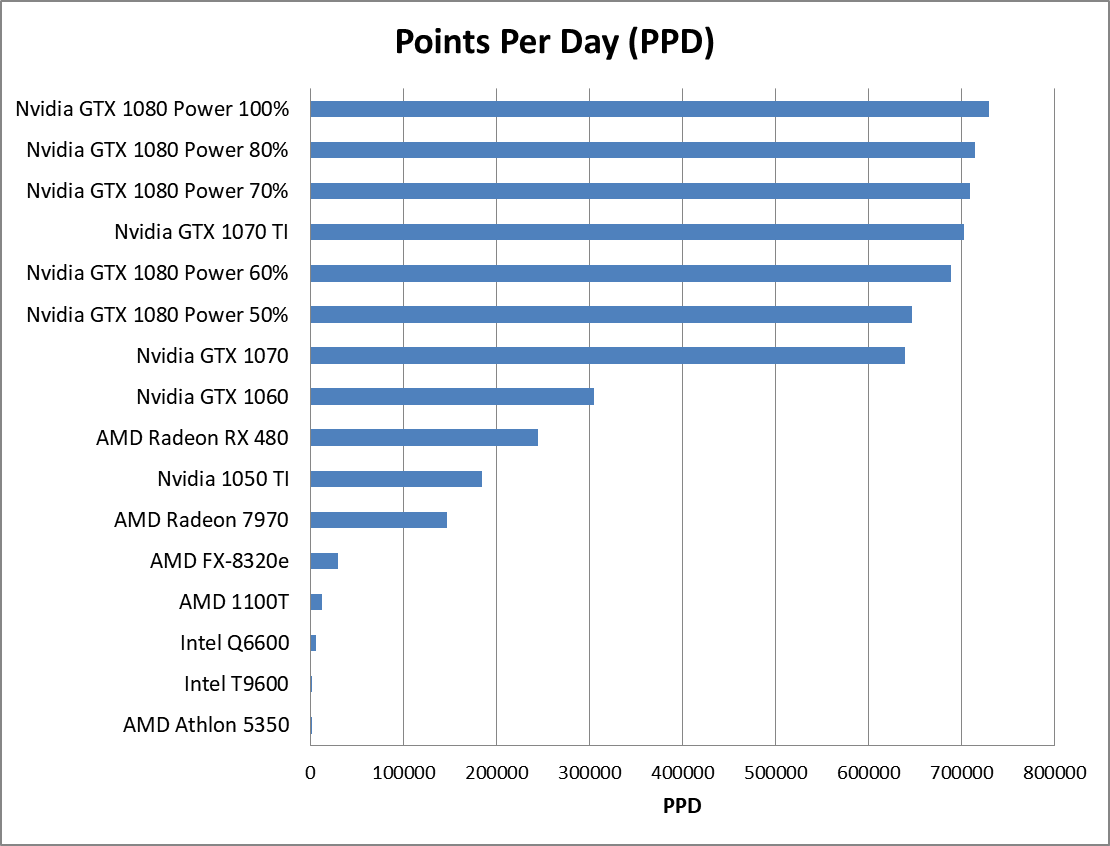
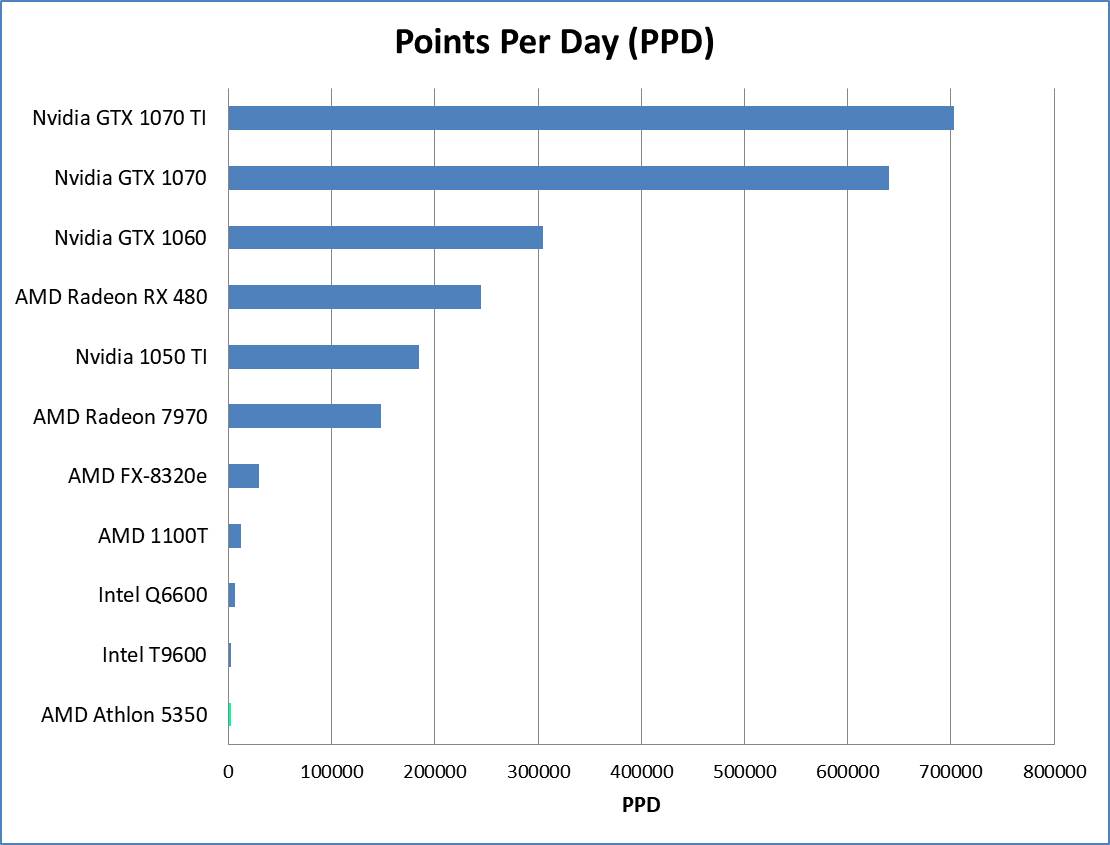
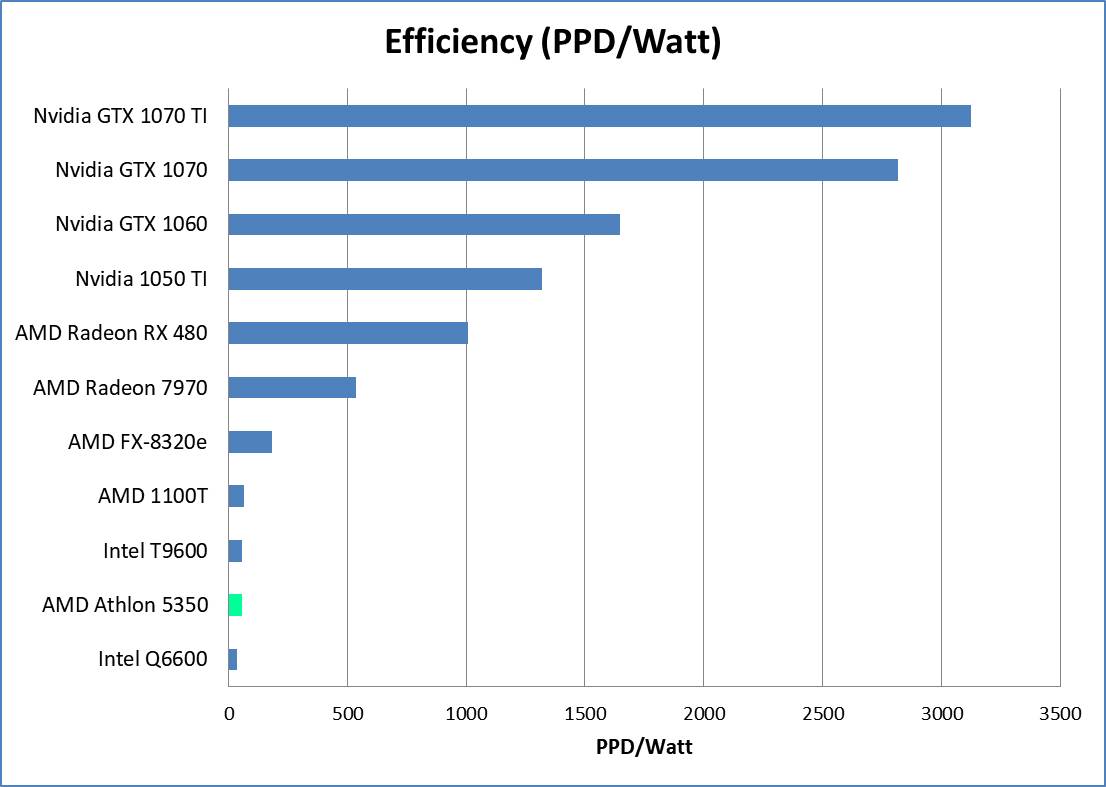
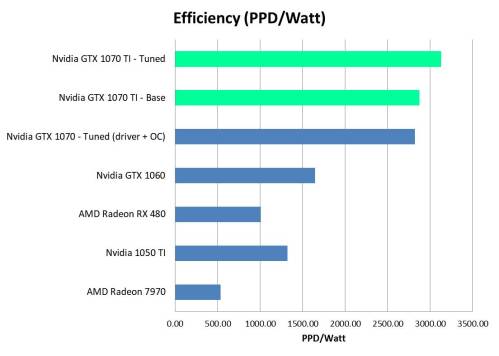
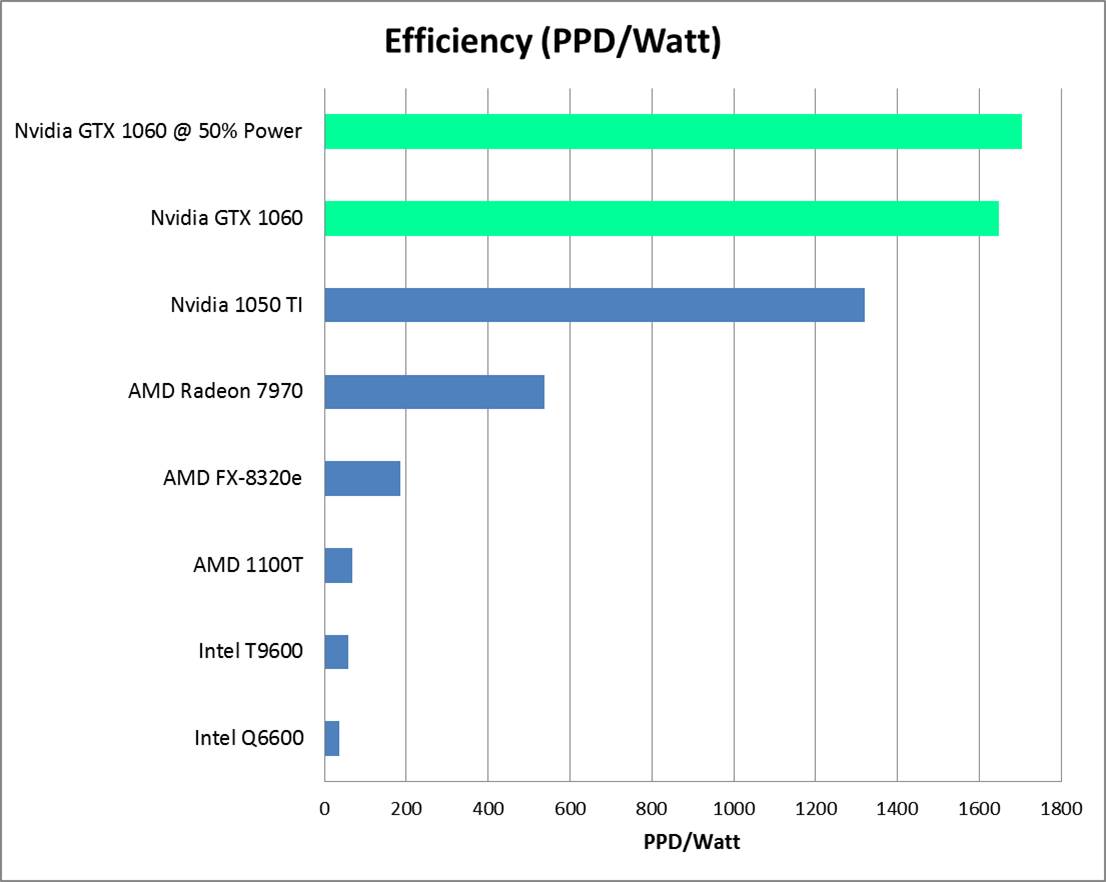
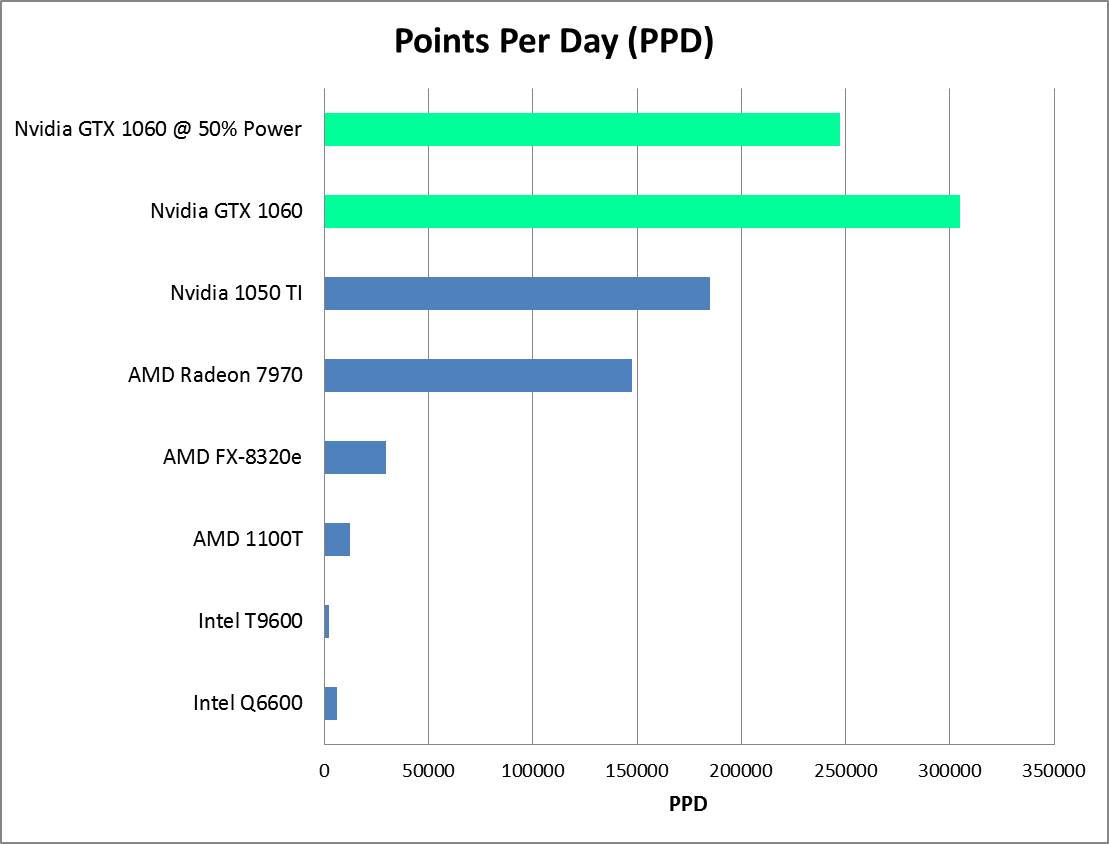
Comparison plots here:
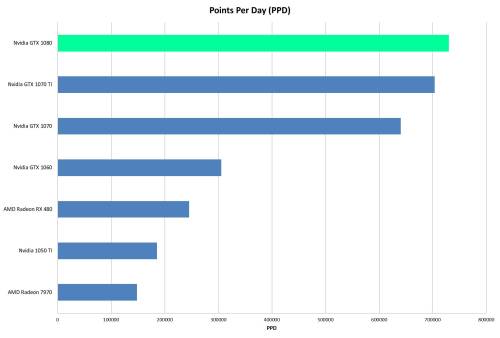
GeForce GTX 1080 Folding@Home PPD Comparison
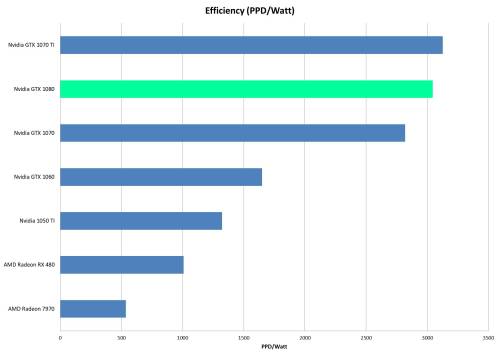
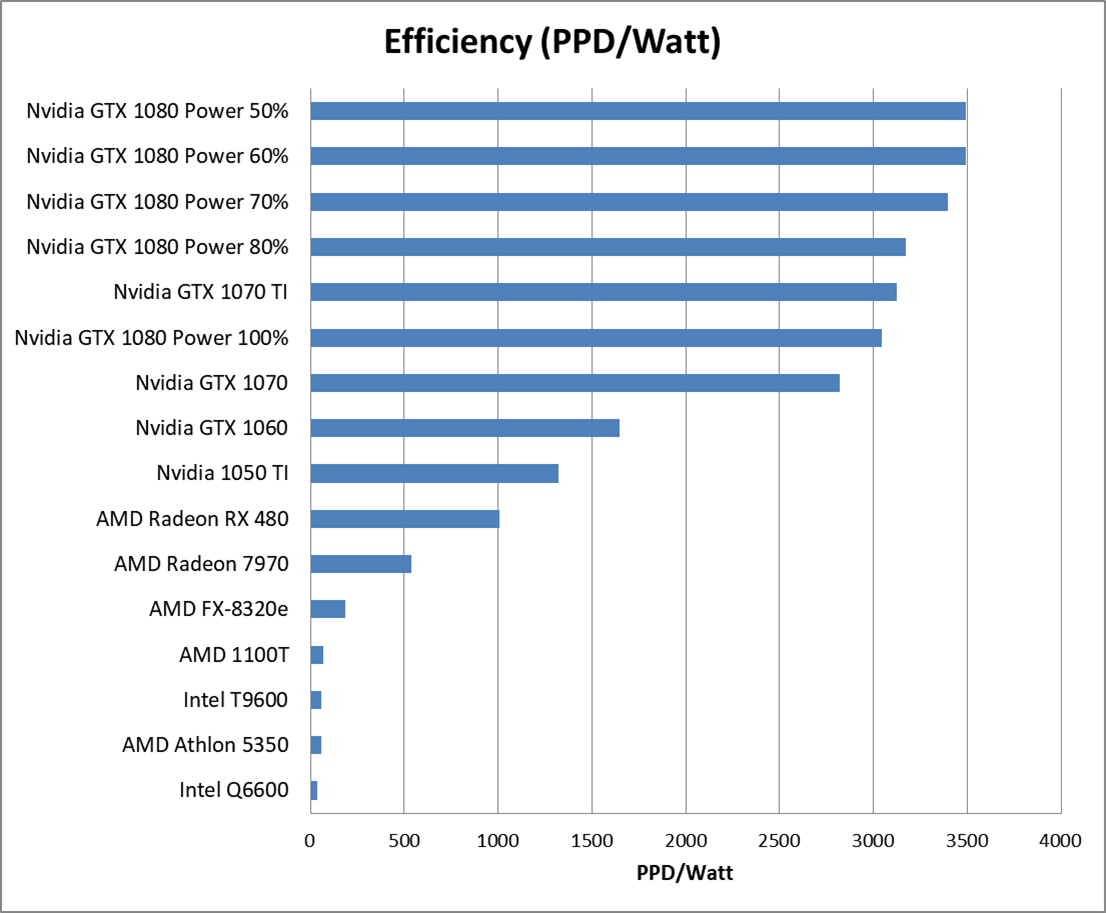
GeForce GTX 1080 Folding@Home Efficiency Comparison
Final Thoughts
The GTX 1080 is a great card. With that said, I’m a bit annoyed that my GTX 1080 didn’t hit 800K PPD like some folks in the forums say theirs do (I bet a lot of those people getting 800K PPD use Linux, as it is a bit better than Windows for folding). Still, this is a good result.
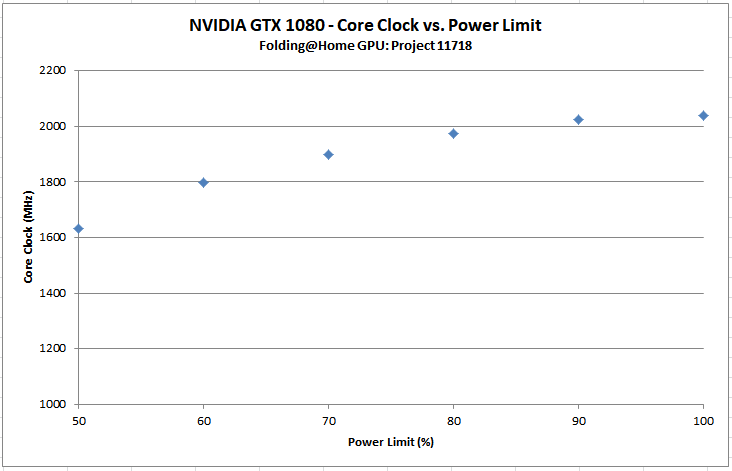
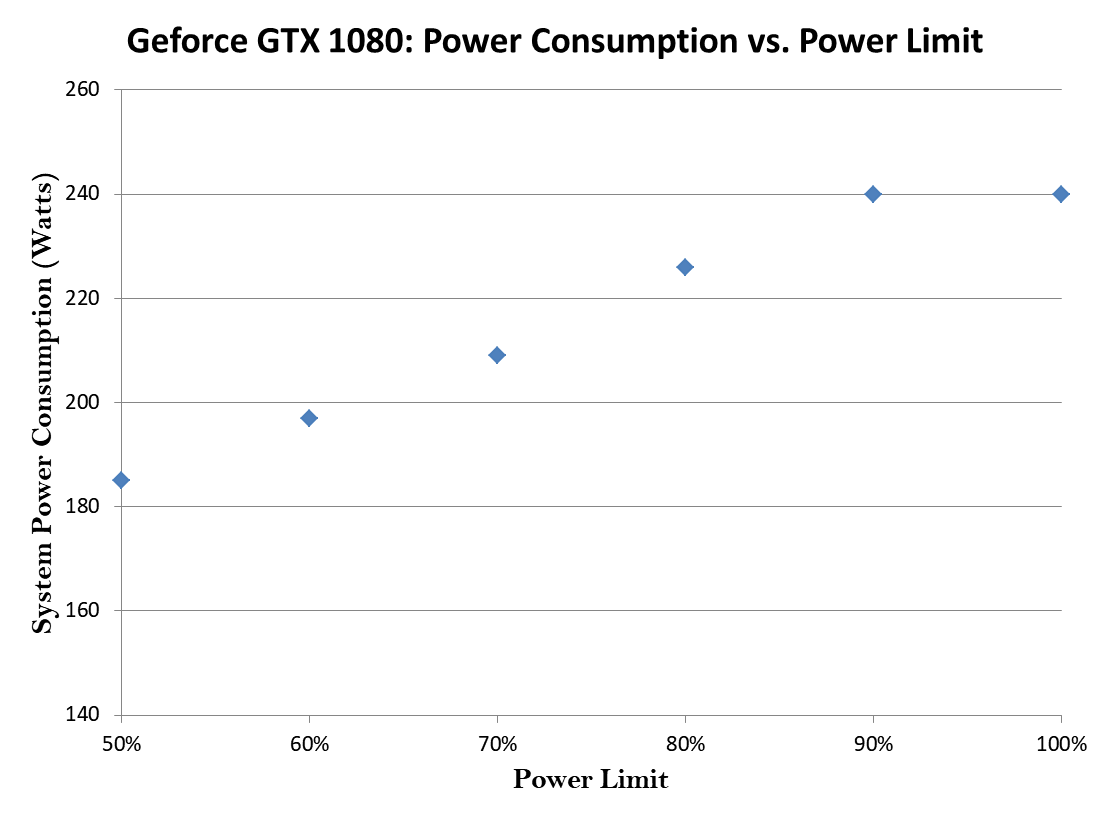
Similarly, I’m annoyed that the GTX 1080 didn’t thoroughly beat my 1070 Ti in terms of efficiency. The results are so close though that it’s effectively the same. This is part one of a multi-part review, where I tuned the card for performance. In the next article, I plan to go after finding a better efficiency point for running this card by experimenting with reducing the power limit. Right now I’m thinking of running the card at 80% power limit for a week, and then at 60% for another week, and reporting the results. So, stay tuned!